Strictly control the same components, pages, and servers under the same conditions,
and compare server-side and client-side performance!
Check the Actual Codebase and deployment environment(Nuxt4, Next16) as well!🤨
Before We Begin
Modern web frameworks (meta frameworks) that are loved worldwide are two frameworks!
That is, Nuxt4 and Next16!
Previous article also mentioned that we will deeply investigate how these two frameworks perform in terms of performance!
As a Nuxter, I sincerely hope that Nuxt4 will have the upper hand in performance…😅
Let’s start the article now!
Project Setup Process of Nuxt4 and Next16
Each framework is implemented in a separate folder in a repository!
To use the same screen and server modules as much as possible, we installed and configured the pages as follows!
Framework Basic Setup
Nuxt4
Hybrid Rendering (SSR + CSR):SSRfollowed byHydrationprocess- UI Framework :
Nuxt UI
Next16
SSR- UI Framework :
Shadcn UI
Screen, Component, Server Configuration
- Page : Home / Counter Page / Server-side Data View Page
- Component : Modal Component
- Server : Simple mock data server
Commonly Installed Modules
- typescript
- prettier
- eslint
- @lhci/cli: Lighthouse CI
- autocannon: Server Benchmark Tool
UI Framework
Nuxt4
@nuxt/ui(tailwindcss and icon library are built-in)
Next16
@tailwindcss,lucide-react@radix-ui/react-dialog(using shadcn/ui)
The detailed folder structure is as follows! (Only showing the core items!)
Hmm… It seems that Nuxt4 has a simpler folder structure this way?😅 (1 win?)
// nuxt4

/nuxt4/
├── app/
│   ├── app.vue
│   ├── assets/
│   ├── components/
│   │   └── AModal.vue         # Modal Component
│   ├── layouts/
│   │   └── default.vue        # Default Layout
│   └── pages/
│       ├── index.vue          # Home Page
│       ├── counter.vue        # Counter Page
│       └── data.vue          # Data Page
├── server/
│   └── api/
│       └── data.get.ts       # API Route (GET)
├── nuxt.config.ts            # Nuxt Configuration
└── package.json
// next16
next16/
├── app/
│ ├── api/
│ │ └── data/
│ │ └── route.ts # API Route
│ ├── counter/
│ │ └── page.tsx # Counter Page
│ ├── data/
│ │ └── page.tsx # Data Page
│ ├── layout.tsx # Root Layout
│ └── page.tsx # Home Page
├── components/
│ ├── Modal.tsx # Modal Component
│ ├── Navigation.tsx # Navigation Component
│ └── ui/
│ ├── button.tsx # Button Component
│ ├── card.tsx # Card Component
│ └── dialog.tsx # Dialog Component
├── lib/
│ ├── counter-store.ts # Counter State Management
│ └── utils.ts # Utility Functions
├── next.config.ts # Next.js Configuration
├── components.json # shadcn/ui Configuration
└── package.json
What Tool Should We Use for Testing?
This part was also very difficult to think about…
Since both frameworks can implement both server-side and client-side functionality, I thought it was necessary to check not only server-side performance but also performance by measuring with lighthouse!
So we decided to use the following tools!
lighthouse cli: Measure benchmark for each page in local and build environmentsautocannon: Measure server-side benchmark in local and build environments
What Environment Should We Measure in?
Next, we thought about this part!
So we prepared to measure in the following environments!
- Measurement in local development environment (FE:
lighthouse cli/ BE:autocannon) - Measurement after deployment through
Github Action(FE:lighthouse cli/ BE:autocannon) - Compare bundle size deployed on
Vercel - Measurement of
lighthousein client environment in deployment environment
This should be enough for comparison, right?😅
Let’s Compare Performance!
Since we have set the basic configuration and measurement method, let’s compare performance sequentially as mentioned above!
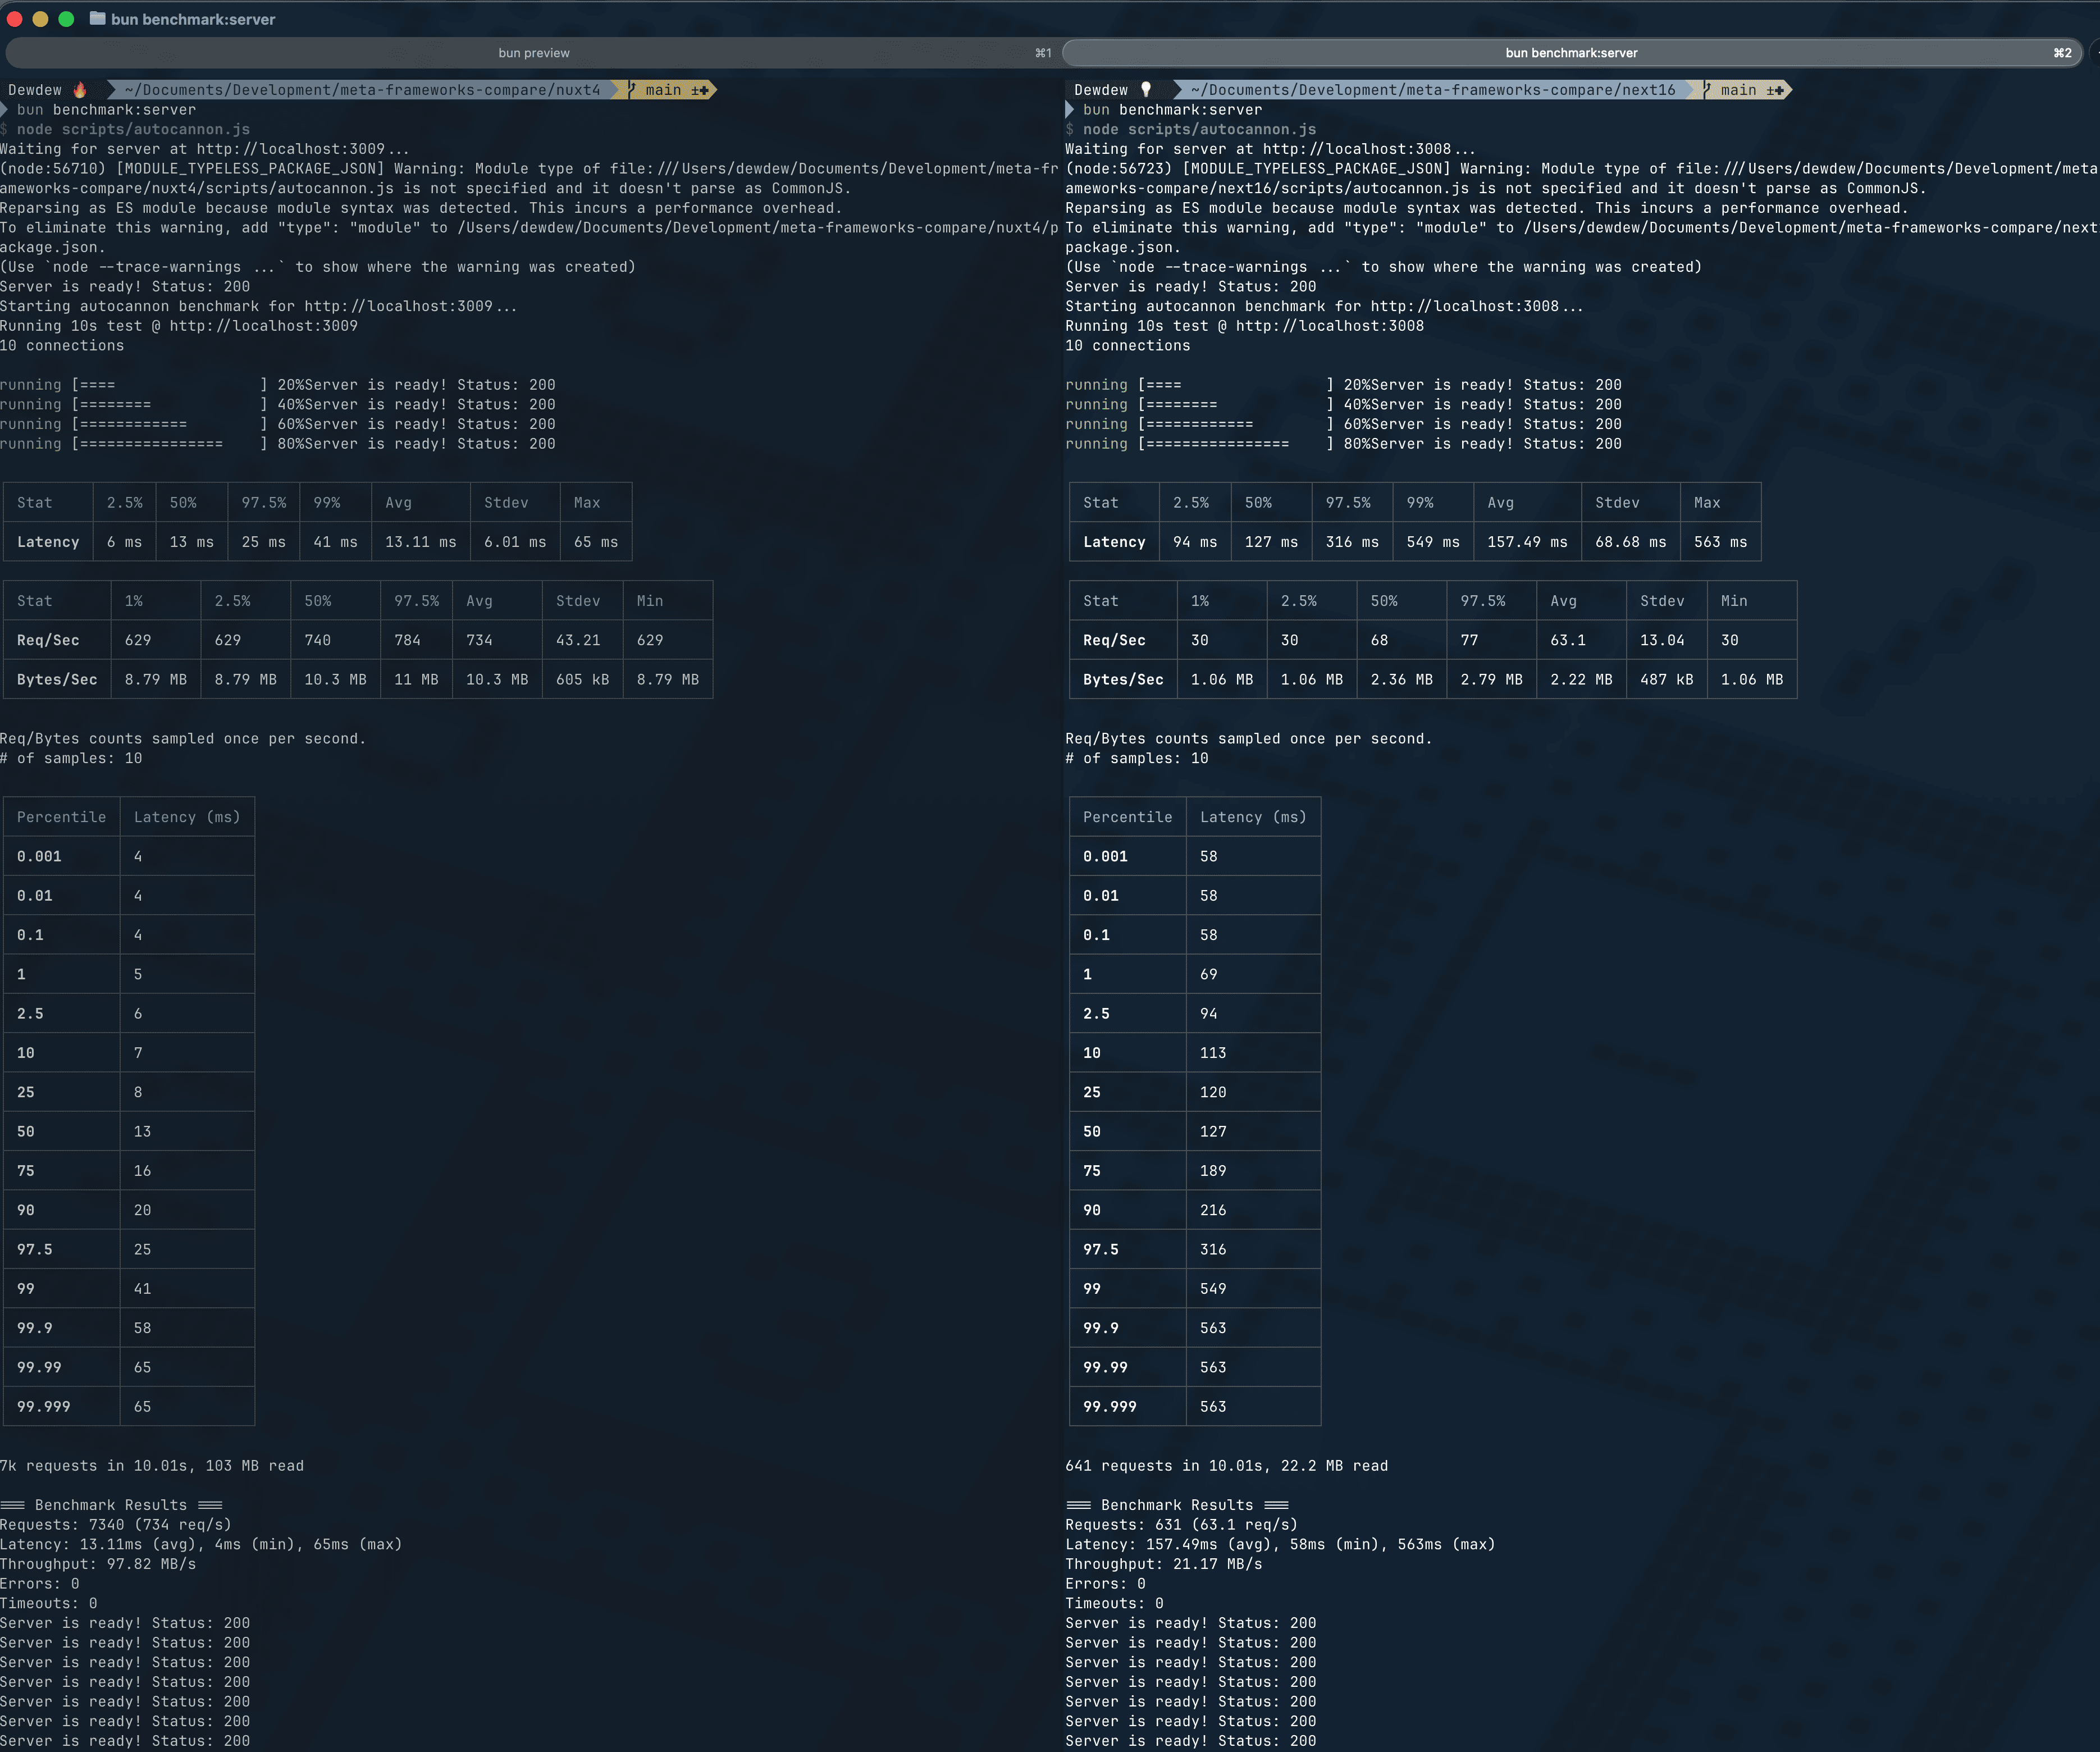
1. Measurement of Server Performance in Local Development Environment
Main Performance Indicators
| Indicator | Nuxt 4 | Next.js 16 | Performance Difference |
|---|---|---|---|
| Average Latency | 13.11ms | 157.49ms | Nuxt 4 is 12 times faster |
| Requests per Second | 734 req/s | 63.1 req/s | Nuxt 4 is 11.6 times more |
| Data Transfer Rate per Second | 97.82 MB/s | 21.17 MB/s | Nuxt 4 is 4.6 times higher |
| Standard Deviation | 6.01ms | 68.68ms | Nuxt 4 is 11.4 times consistent |
Latency Distribution
| Percentile | Nuxt 4 | Next.js 16 | Difference |
|---|---|---|---|
| 0.001% (Minimum) | 4ms | 58ms | 14.5 times |
| 2.5% | 6ms | 96ms | 16 times |
| 50% (Median) | 13ms | 127ms | 9.8 times |
| 97.5% | 25ms | 316ms | 12.6 times |
| 99% | 41ms | 549ms | 13.4 times |
| 99.9% | 58ms | 563ms | 9.7 times |
| 99.99% (Maximum) | 65ms | 563ms | 8.7 times |
Request/Data Processing Statistics
| Item | Nuxt 4 | Next.js 16 | Difference |
|---|---|---|---|
| Req/Sec (1%) | 629 | 30 | 21 times |
| Req/Sec (2.5%) | 629 | 30 | 21 times |
| Req/Sec (50%) | 740 | 68 | 10.9 times |
| Req/Sec (97.5%) | 784 | 77 | 10.2 times |
| Bytes/Sec (Average) | 10.3 MB | 2.22 MB | 4.6 times |
Total Processing (10 seconds)
| Item | Nuxt 4 | Next.js 16 | Difference |
|---|---|---|---|
| Total Requests | 7,360 requests | 641 requests | 11.5 times |
| Total Data Transfer | 103 MB | 23.2 MB | 4.4 times |
| Error | 0 | 0 | Same |
| Timeout | 0 | 0 | Same |
In the local environment test, Nuxt 4 clearly has the upper hand over Next.js 16!
- Response Speed: 12 times faster
- Processing Rate: 11.6 times more
- Stability: The standard deviation is much lower, making it more consistent
- Scalability: Processing 11.5 times more requests in the same time
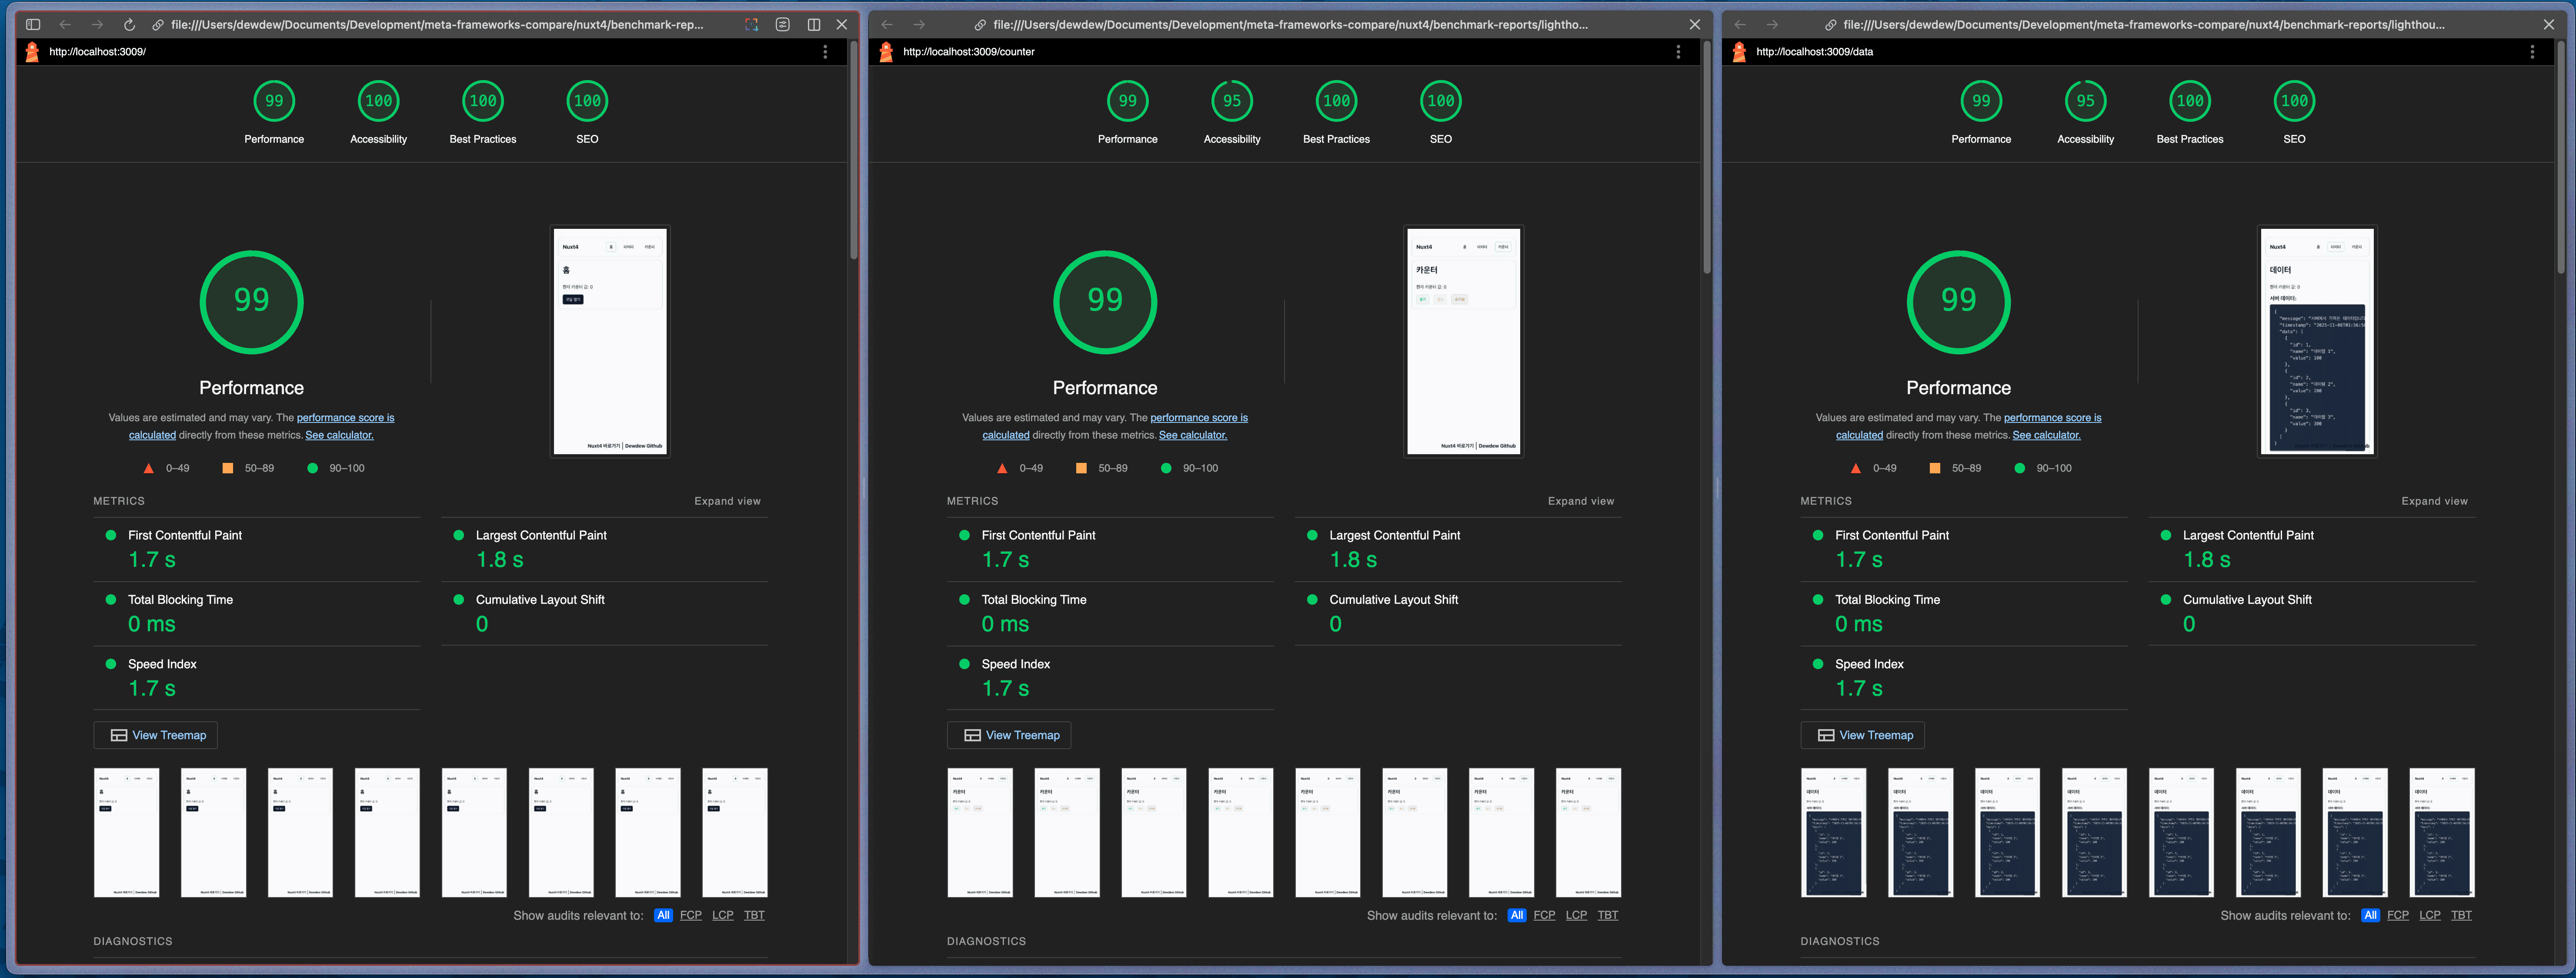
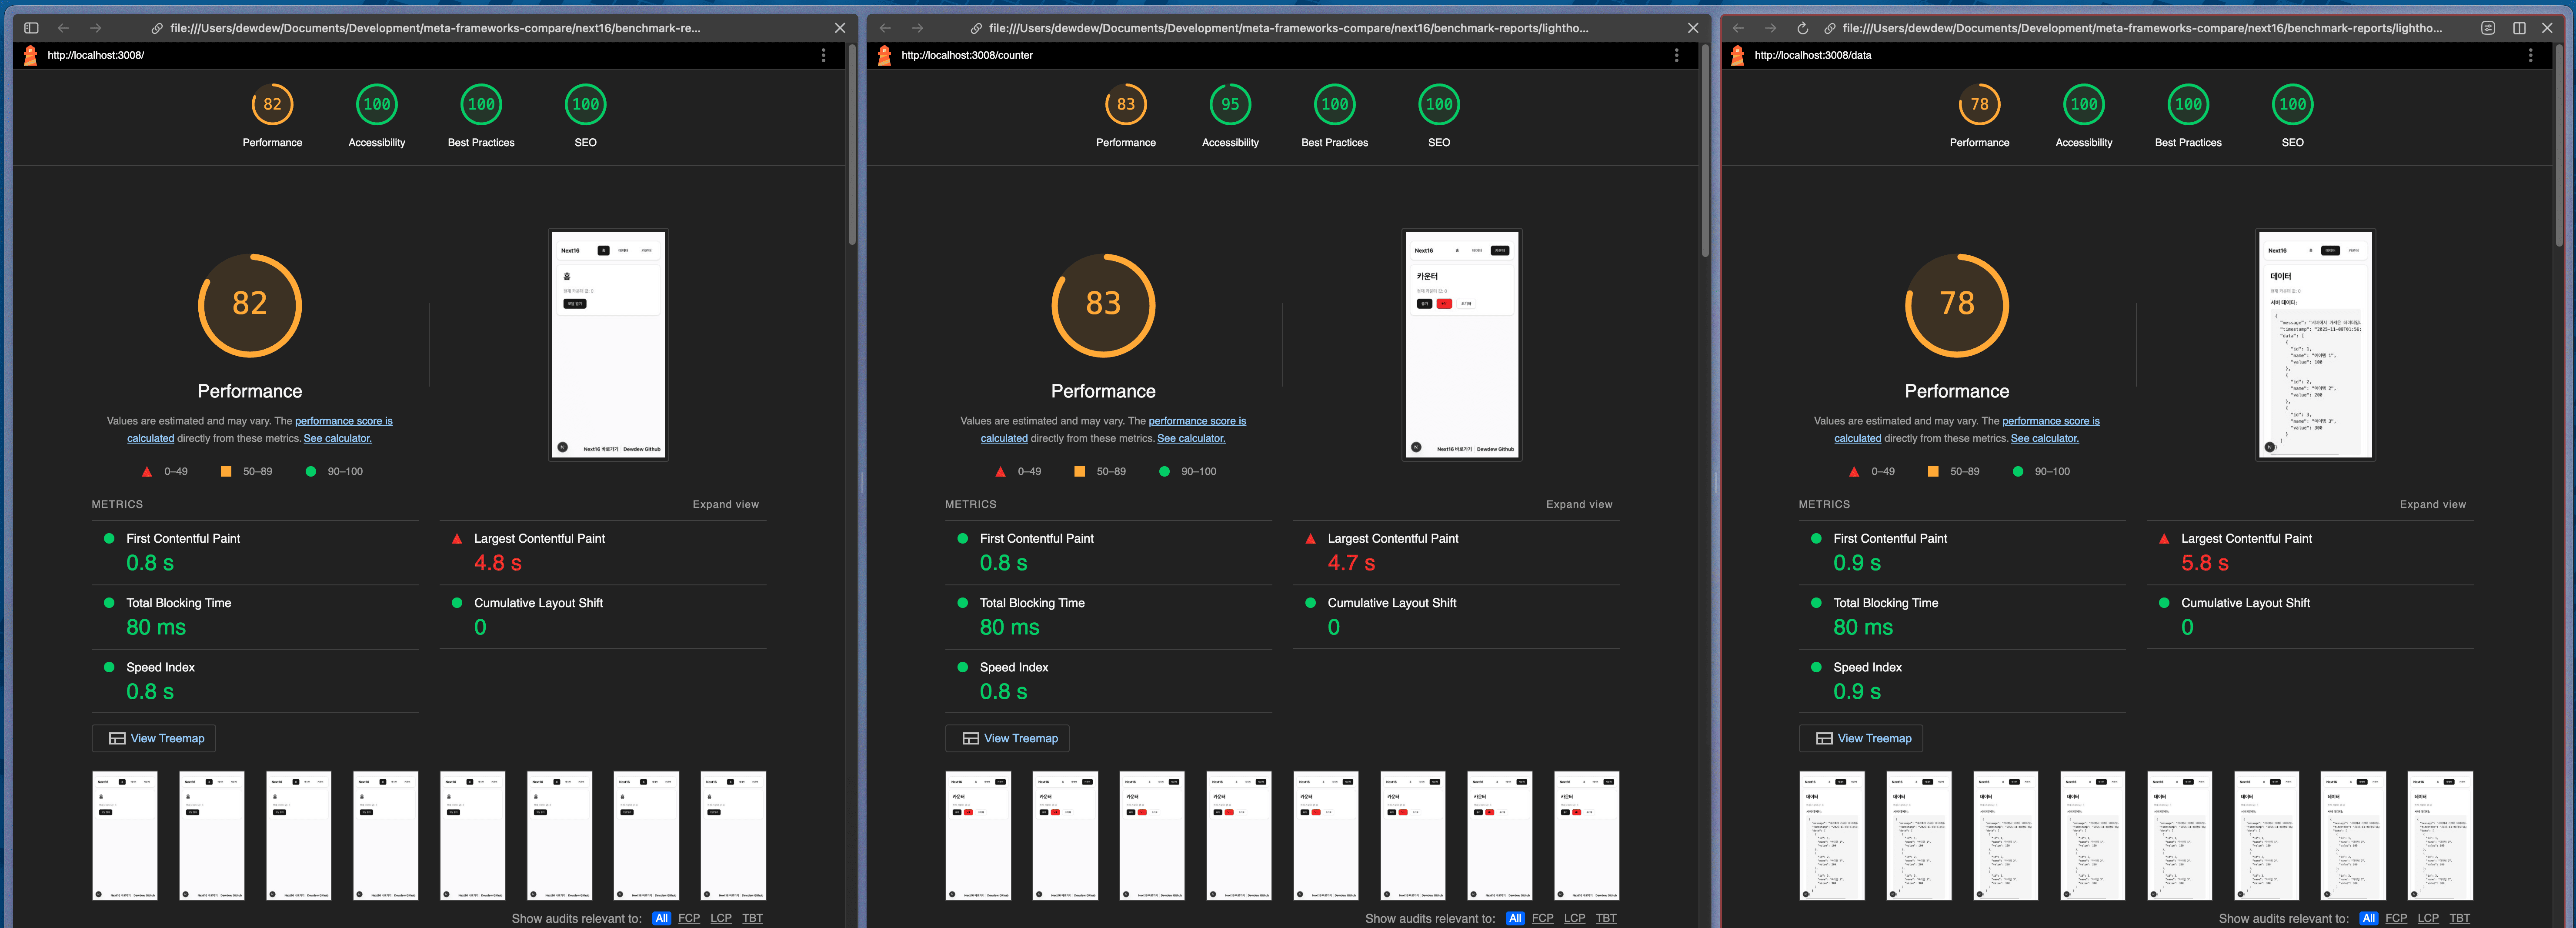
2. Measurement of Client Performance in Local Development Environment
Nuxt 4 - Lighthouse Performance Measurement Result (Total 3 Measurements)
| Measurement Trial | Performance | Accessibility | Best Practices | SEO |
|---|---|---|---|---|
| 1st Measurement | 99 🟢 | 100 🟢 | 100 🟢 | 100 🟢 |
| 2nd Measurement | 99 🟢 | 100 🟢 | 100 🟢 | 100 🟢 |
| 3rd Measurement | 99 🟢 | 100 🟢 | 100 🟢 | 100 🟢 |
| Average | 99 | 100 | 100 | 100 |
Nuxt 4 - Detailed Metrics (Average)
| Metric | 1st | 2nd | 3rd | Average |
|---|---|---|---|---|
| First Contentful Paint | 1.7s | 1.7s | 1.7s | 1.7s 🟢 |
| Largest Contentful Paint | 1.8s | 1.8s | 1.8s | 1.8s 🟢 |
| Total Blocking Time | 0ms | 10ms | 10ms | 6.7ms 🟢 |
| Speed Index | 1.7s | 1.7s | 1.7s | 1.7s 🟢 |
| Cumulative Layout Shift | 0 | 0 | 0 | 0 🟢 |

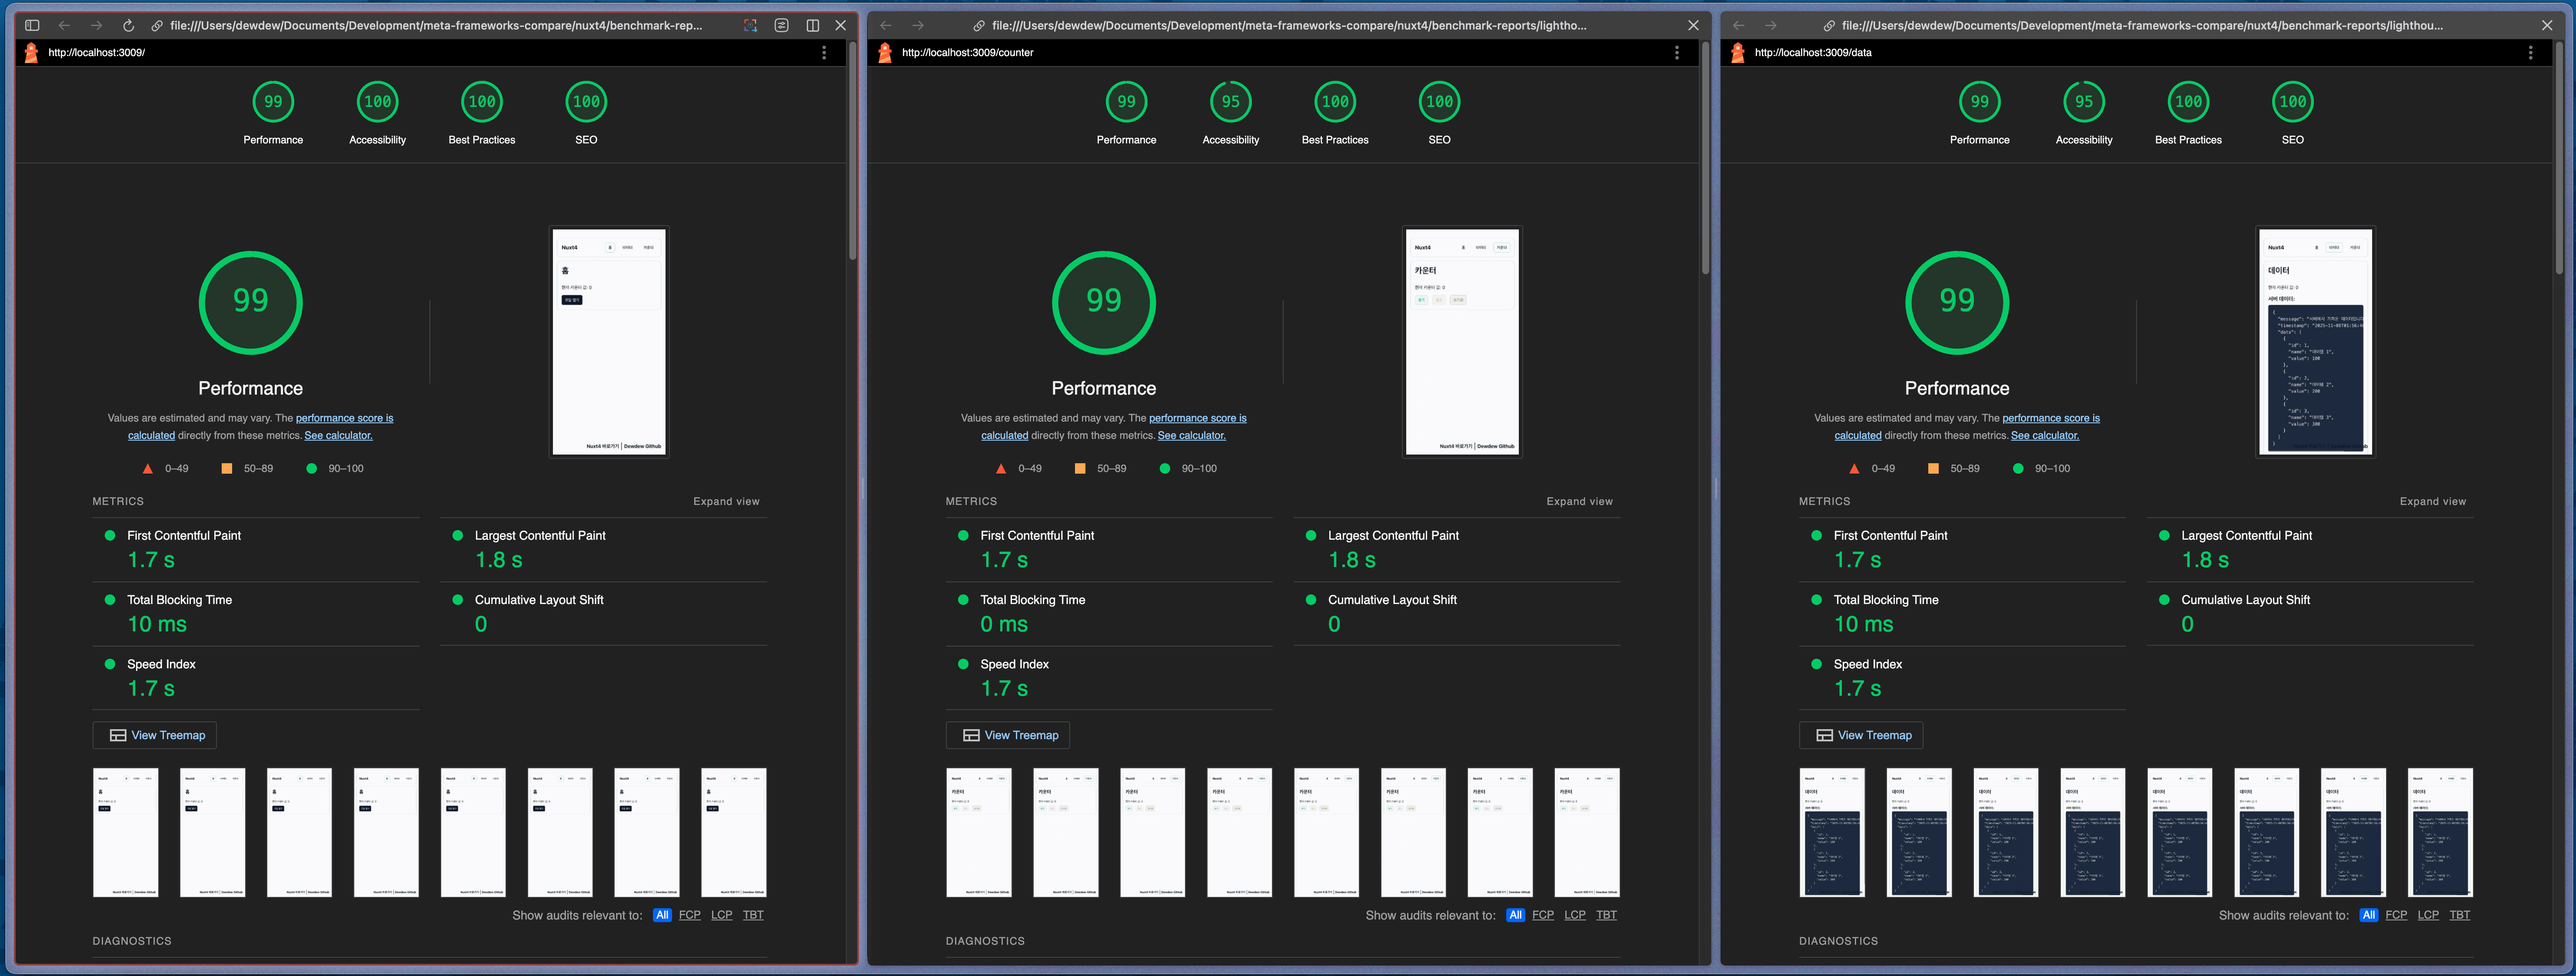
Next.js 16 - Lighthouse Performance Measurement Result (Total 3 Measurements)
| Measurement Trial | Performance | Accessibility | Best Practices | SEO |
|---|---|---|---|---|
| 1st Measurement | 81 🟠 | 100 🟢 | 100 🟢 | 100 🟢 |
| 2nd Measurement | 82 🟠 | 100 🟢 | 100 🟢 | 100 🟢 |
| 3rd Measurement | 83 🟠 | 100 🟢 | 100 🟢 | 100 🟢 |
| Average | 82 | 100 | 100 | 100 |
Next.js 16 - Detailed Metrics
| Metric | 1st | 2nd | 3rd | Average |
|---|---|---|---|---|
| First Contentful Paint | 0.8s | 0.8s | 0.8s | 0.8s 🟢 |
| Largest Contentful Paint | 4.8s | 4.8s | 4.7s | 4.77s 🔴 |
| Total Blocking Time | 150ms | 80ms | 80ms | 103.3ms 🟠 |
| Speed Index | 0.8s | 0.8s | 0.8s | 0.8s 🟢 |
| Cumulative Layout Shift | 0 | 0 | 0 | 0 🟢 |


Performance Score Comparison
| Framework | Average Score | Deviation | Stability | Grade |
|---|---|---|---|---|
| Nuxt 4 | 99 🟢 | ±0 | Perfect | A+ |
| Next.js 16 | 82 🟠 | ±1 | Good | B |
| Difference | +17 points | - | - | - |
Core Performance Metrics Comparison
| Metric | Nuxt 4 | Next.js 16 | Winner | Difference |
|---|---|---|---|---|
| First Contentful Paint (FCP) | 1.7s | 0.8s | Next.js 16 | 2.1 times faster |
| Largest Contentful Paint (LCP) | 1.8s | 4.77s | Nuxt 4 | 2.65 times faster |
| Total Blocking Time (TBT) | 6.7ms | 103.3ms | Nuxt 4 | 15.4 times less |
| Speed Index | 1.7s | 0.8s | Next.js 16 | 2.1 times faster |
| Cumulative Layout Shift (CLS) | 0 | 0 | Same | Same |
Measurement Stability
| Framework | Performance Variation | Metric Consistency | Evaluation |
|---|---|---|---|
| Nuxt 4 | None (99→99→99) | Very High | ⭐⭐⭐⭐⭐ |
| Next.js 16 | Slight (81→82→83) | High | ⭐⭐⭐⭐ |
Nuxt 4’s Advantages
- Overall Performance Score: 99 points for almost perfect
- LCP (Largest Contentful Paint): 1.8 seconds for excellent (2.5 seconds or less recommended)
- TBT (Total Blocking Time): 6.7ms for almost none (200ms or less recommended)
- Consistency: The results of the 3 measurements are all the same, making it very stable
- Layout Stability: CLS 0 for perfect
Next.js 16’s Features
- FCP (First Contentful Paint): 0.8 seconds for very fast
- Speed Index: 0.8 seconds for very good
- LCP Issue: 4.77 seconds exceeds the recommended standard (2.5 seconds) 🔴
- TBT Issue: 103.3ms is somewhat high (recommended: 200ms or less, but ideally even lower)
- Gradual Improvement: 81→82→83 for each measurement, slightly improving
Nuxt 4’s Advantages
- LCP is 2.65 times faster (the time users actually see the content)
- TBT is 15 times or more less (JavaScript blocking minimization)
- Overall Performance Score is 17 points higher
Next.js 16’s Advantages
- FCP and Speed Index are 2 times faster (first screen display speed)
- Initial rendering is faster, but overall content loading is slower
Overall Evaluation
| Evaluation Item | Nuxt 4 | Next.js 16 | Winner |
|---|---|---|---|
| Overall Performance | 99 | 82 | Nuxt 4 |
| Initial Rendering Speed | Good | Excellent | Next.js 16 |
| Main Content Loading | Excellent | Poor | Nuxt 4 |
| JavaScript Execution | Excellent | Average | Nuxt 4 |
| Stability/Consistency | Perfect | Good | Nuxt 4 |
| SEO/Accessibility | 100 | 100 | Same |
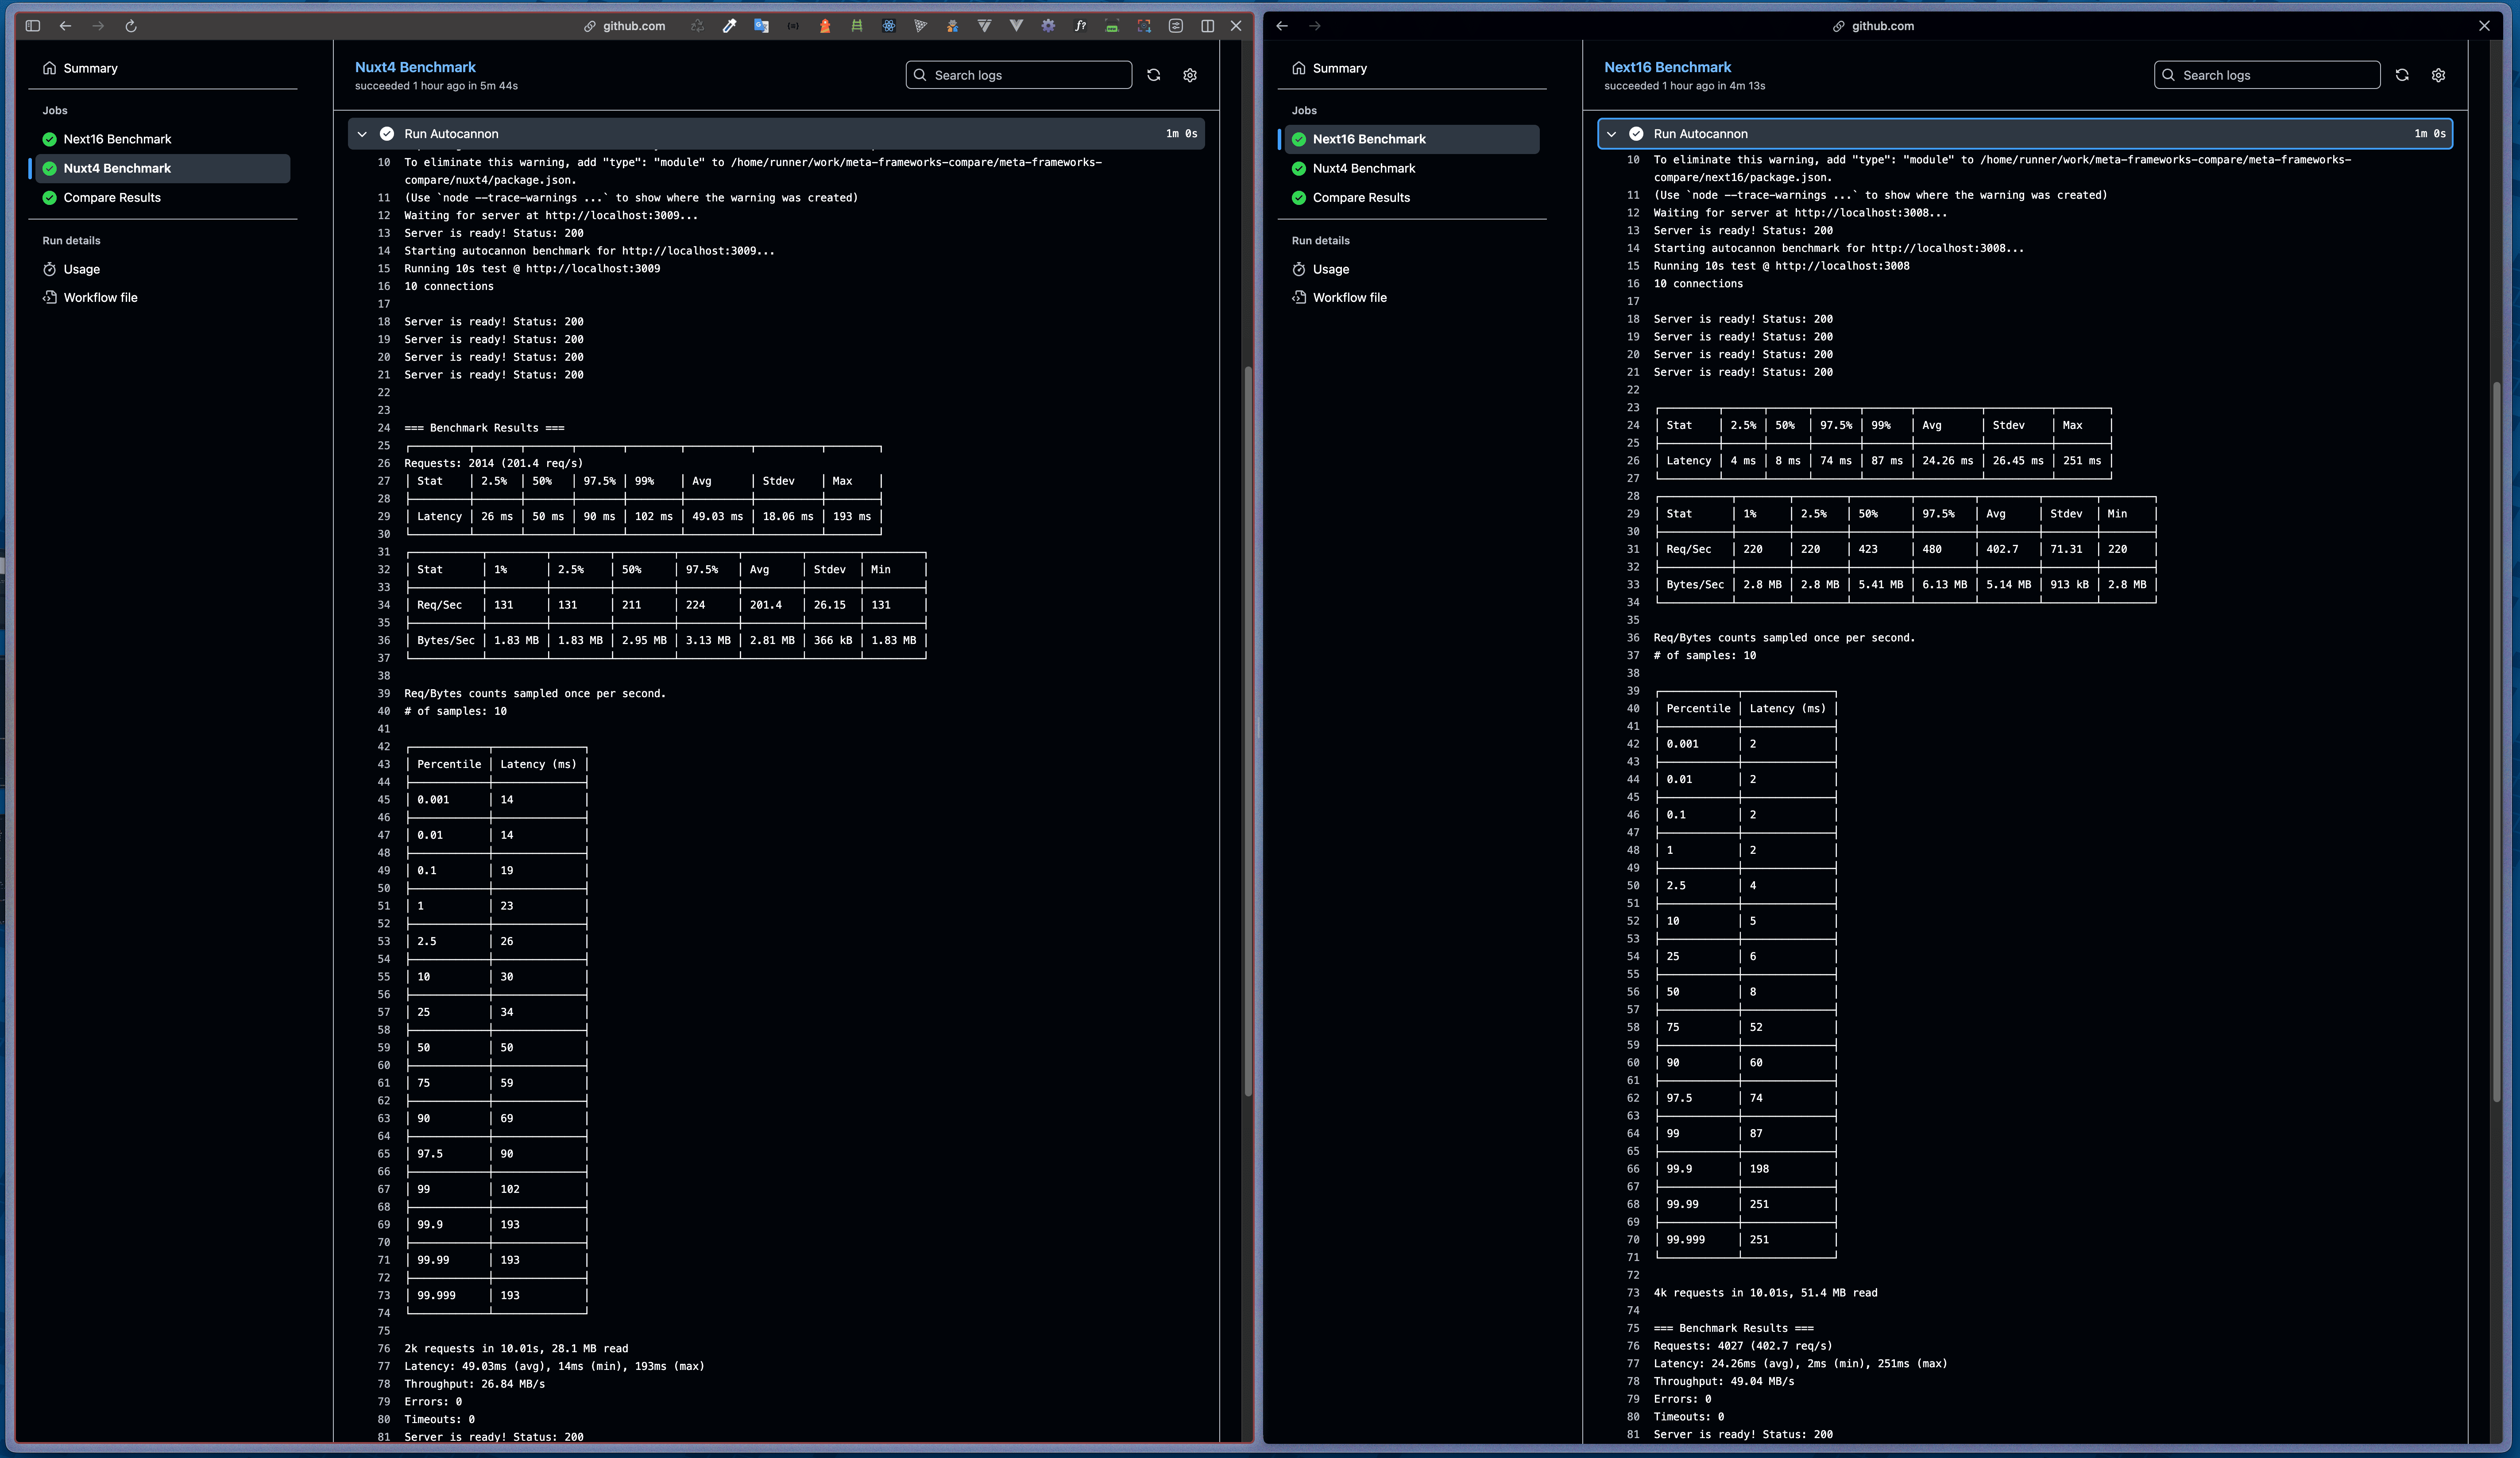
3. Measurement of Server Performance in Deployment Environment (Github Actions)
Main Performance Indicators
| Indicator | Nuxt 4 | Next.js 16 | Performance Difference |
|---|---|---|---|
| Average Latency | 69.62ms | 24.20ms | Next16 is 2.88 times faster |
| Requests per Second | 294.4 req/s | 407.7 req/s | Next16 is 38.5% more |
| Data Transfer Rate per Second | 26.48 MB/s | 76.74 MB/s | Next16 is 2.90 times higher |
| Standard Deviation | 18.66ms | 26.45ms | Nuxt4 is more consistent |
Latency Distribution
| Percentile | Nuxt 4 | Next.js 16 | Difference |
|---|---|---|---|
| Minimum (Min) | 14ms | 2ms | 7 times |
| 2.5% | 26ms | 4ms | 6.5 times |
| 50% (Median) | 68ms | 8ms | 8.5 times |
| 97.5% | 107ms | 87ms | 1.23 times |
| 99% | 182ms | 87ms | 2.09 times |
| Maximum (Max) | 193ms | 251ms | Nuxt 4 is lower |
Request Processing Statistics
| Percentile | Nuxt 4 | Next.js 16 | Difference |
|---|---|---|---|
| 1% | 131 req/s | 228 req/s | 1.74 times |
| 2.5% | 131 req/s | 228 req/s | 1.74 times |
| 50% | 131 req/s | 433 req/s | 3.31 times |
| 97.5% | 228 req/s | 488 req/s | 2.14 times |
| Average | 294.4 req/s | 407.7 req/s | 1.38 times |
| Minimum (Min) | 131 req/s | 228 req/s | 1.74 times |
Data Transfer Rate Statistics
| Percentile | Nuxt 4 | Next.js 16 | Difference |
|---|---|---|---|
| 1% | 1.83 MB/s | 2.8 MB/s | 1.53 times |
| 2.5% | 1.83 MB/s | 2.8 MB/s | 1.53 times |
| 50% | 2.95 MB/s | 5.43 MB/s | 1.84 times |
| 97.5% | 3.13 MB/s | 6.13 MB/s | 1.96 times |
| Average | 2.81 MB/s | 5.14 MB/s | 1.83 times |
Total Processing (10 seconds)
| Item | Nuxt 4 | Next.js 16 | Difference |
|---|---|---|---|
| Total Requests | 2,944 requests | 4,822 requests | 1.64 times (63.8% more) |
| Total Data Transfer | 28.1 MB | 31.8 MB | 1.13 times (13.2% more) |
| Error | 0 | 0 | Same |
| Timeout | 0 | 0 | Same |
In the deployment environment, Next.js 16 performed well!?
- Average Response Time: 2.88 times faster
- Request Processing Rate: 38.5% higher (10 seconds: 1,878 more requests)
- Data Transfer Rate: 2.9 times higher
- Median Latency: 8.5 times faster
- 50% Percentile Request Processing Rate: 3.31 times higher
However, Nuxt 4 has lower standard deviation, making it more consistent performance.
4. Measurement of FE Performance in Deployment Environment (Github Actions)
Nuxt 4 - Lighthouse Performance Measurement Result (3 Measurements)
| Measurement Trial | Performance | Accessibility | Best Practices | SEO |
|---|---|---|---|---|
| 1st Measurement | 99 🟢 | 100 🟢 | 100 🟢 | 100 🟢 |
| 2nd Measurement | 99 🟢 | 100 🟢 | 100 🟢 | 100 🟢 |
| 3rd Measurement | 93 🟢 | 100 🟢 | 100 🟢 | 100 🟢 |
| Average | 97 | 100 | 100 | 100 |
Nuxt 4 - Detailed Metrics
| Metric | 1st | 2nd | 3rd | Average |
|---|---|---|---|---|
| First Contentful Paint | 1.7s | 1.7s | 2.0s | 1.8s 🟢 |
| Largest Contentful Paint | 1.8s | 1.8s | 2.1s | 1.9s 🟢 |
| Total Blocking Time | 60ms | 50ms | 170ms | 93.3ms 🟢 |
| Speed Index | 1.7s | 1.7s | 4.0s | 2.47s 🟠 |
| Cumulative Layout Shift | 0 | 0 | 0 | 0 🟢 |


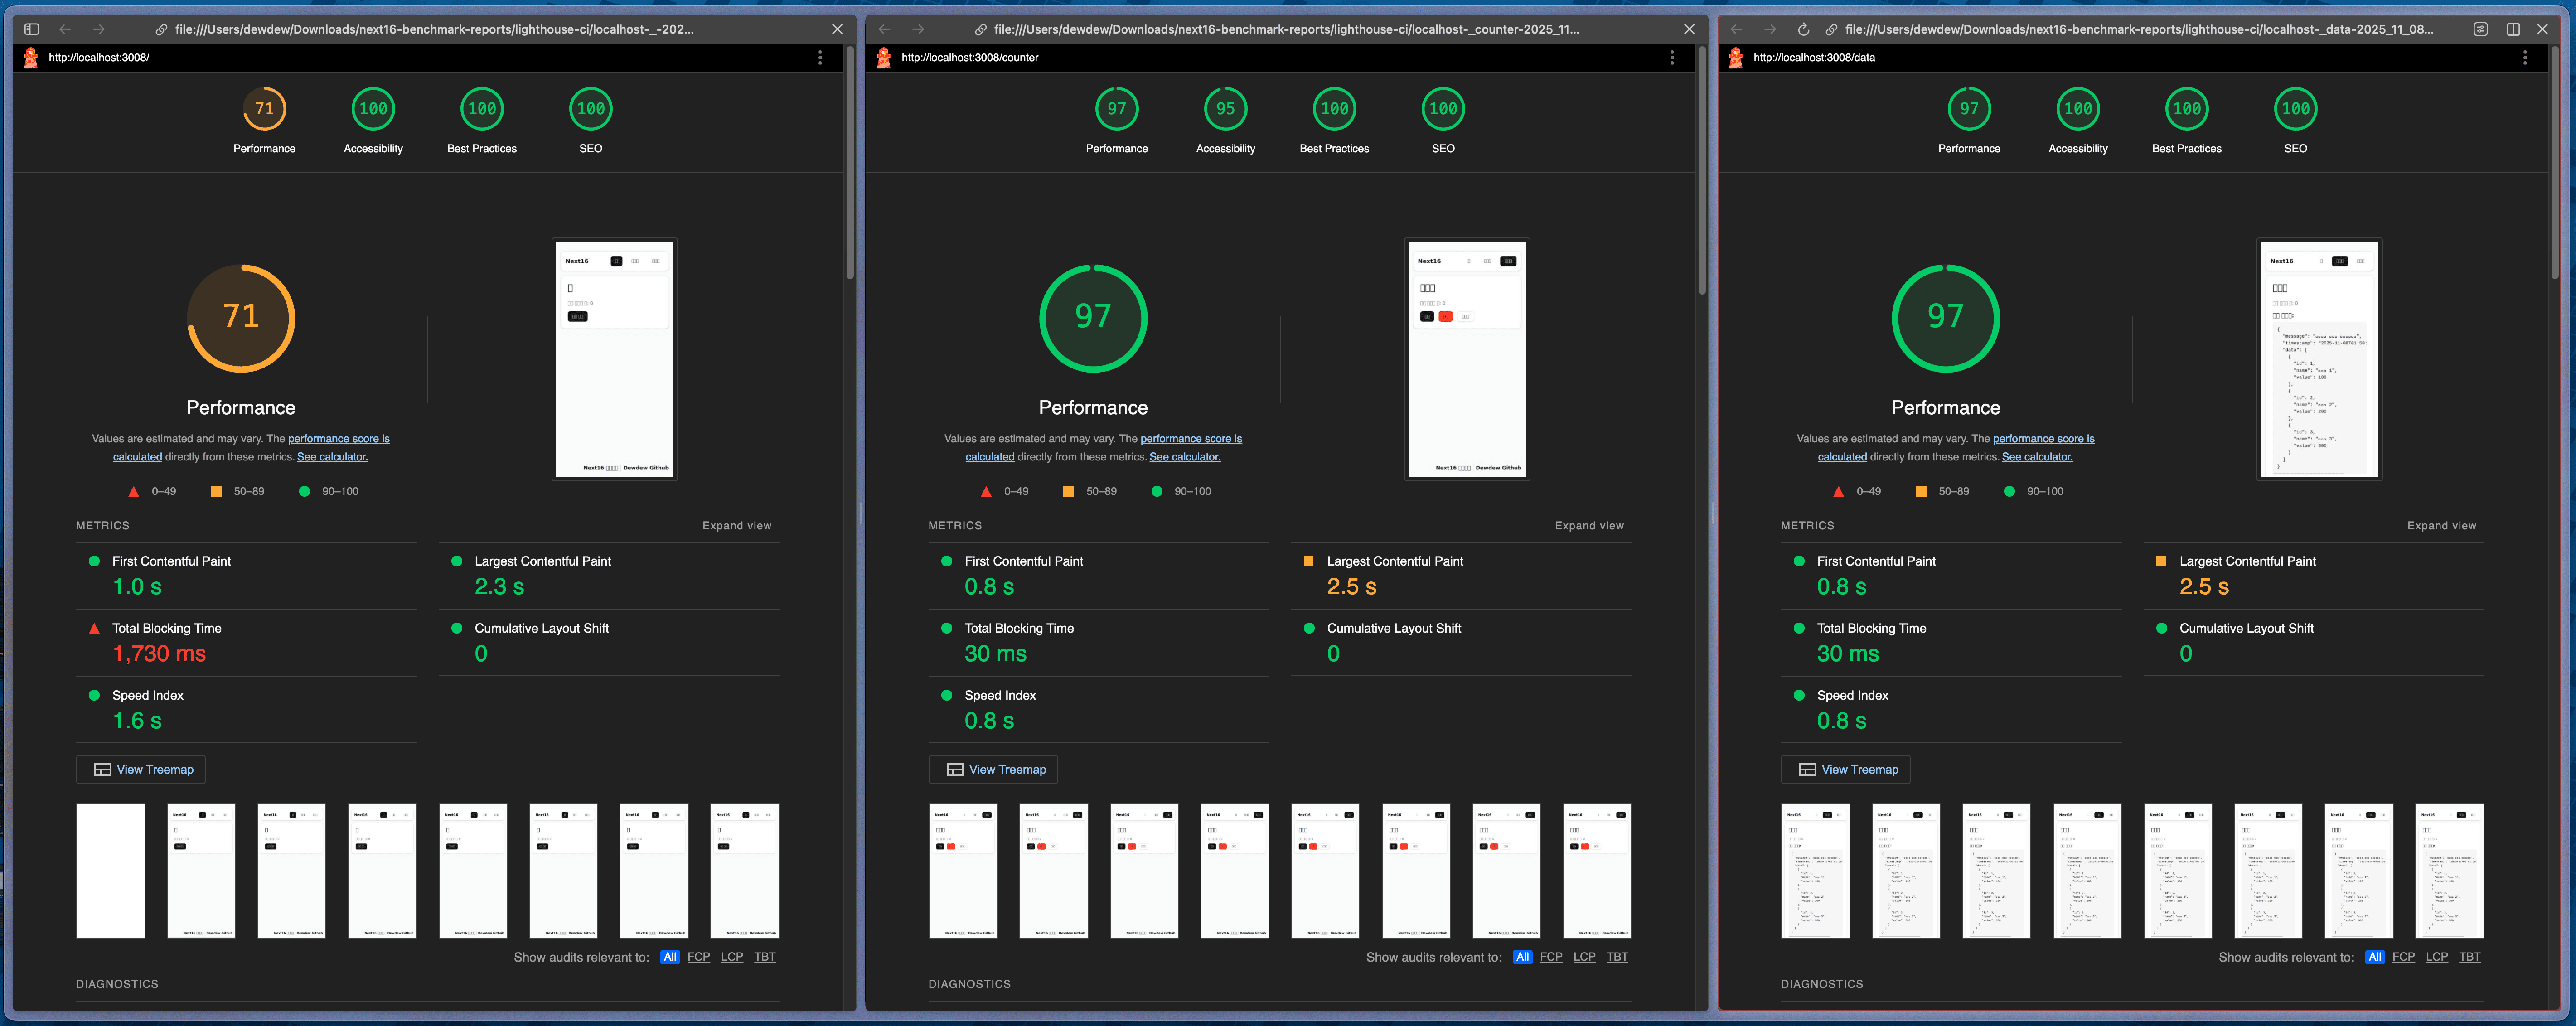
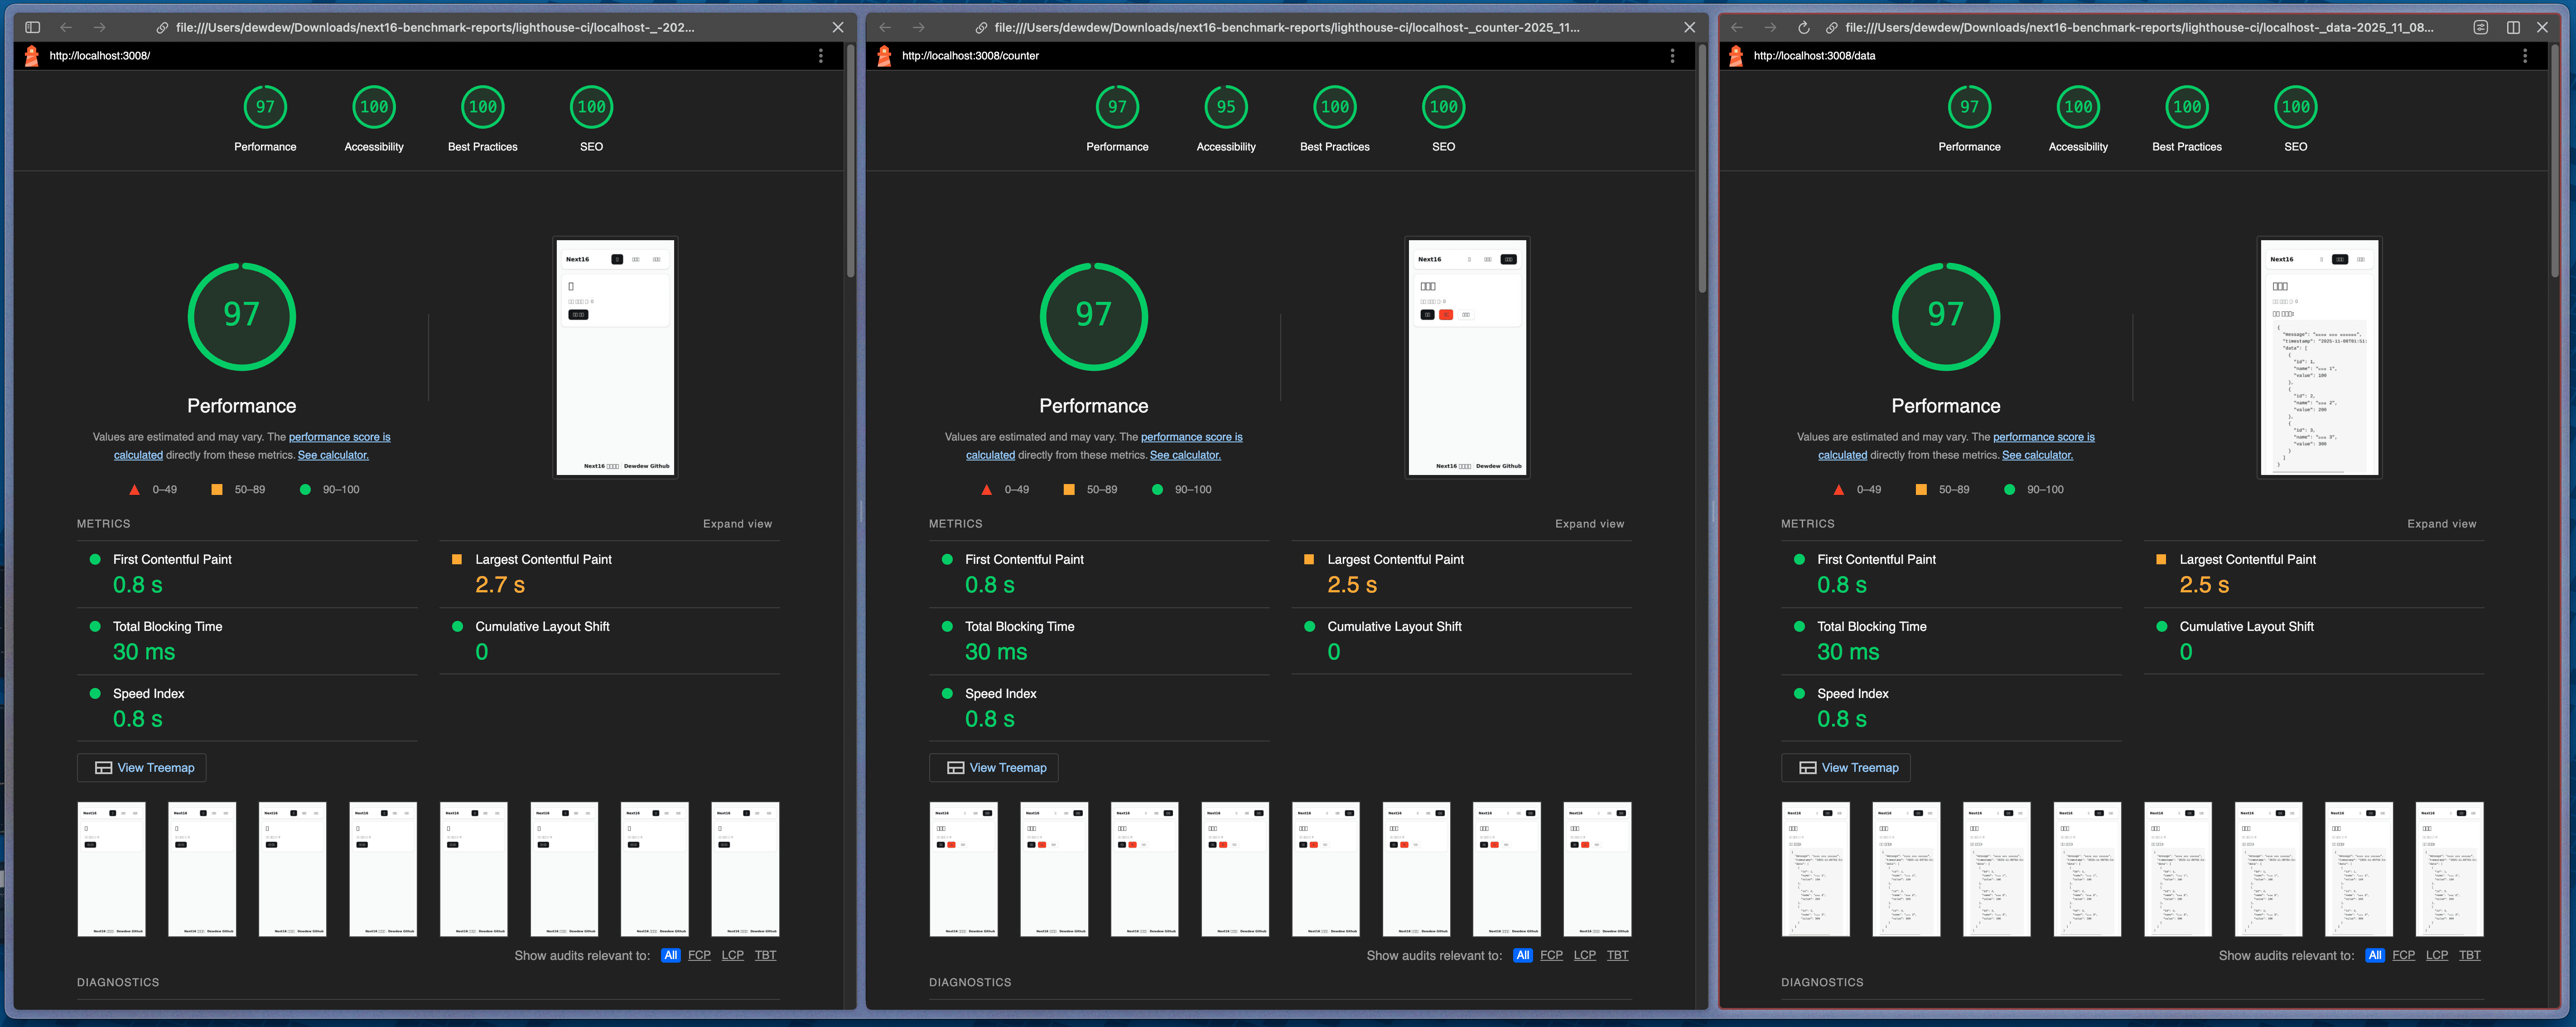
Next.js 16 - Lighthouse Performance Measurement Result (3 Measurements)
| Measurement Trial | Performance | Accessibility | Best Practices | SEO |
|---|---|---|---|---|
| 1st Measurement | 71 🟠 | 100 🟢 | 100 🟢 | 100 🟢 |
| 2nd Measurement | 97 🟢 | 100 🟢 | 100 🟢 | 100 🟢 |
| 3rd Measurement | 97 🟢 | 100 🟢 | 100 🟢 | 100 🟢 |
| Average | 88.3 | 100 | 100 | 100 |
Next.js 16 - Detailed Metrics
| Metric | 1st | 2nd | 3rd | Average |
|---|---|---|---|---|
| First Contentful Paint | 1.0s | 0.8s | 0.8s | 0.87s 🟢 |
| Largest Contentful Paint | 2.3s | 2.5s | 2.5s | 2.43s 🟢 |
| Total Blocking Time | 1,730ms | 30ms | 30ms | 596.7ms 🔴 |
| Speed Index | 1.6s | 0.8s | 0.8s | 1.07s 🟢 |
| Cumulative Layout Shift | 0 | 0 | 0 | 0 🟢 |

Performance Score Comparison
| Framework | Average Score | Highest | Lowest | Deviation | Stability |
|---|---|---|---|---|---|
| Nuxt 4 | 97 🟢 | 99 | 93 | ±3 | Excellent |
| Next.js 16 | 88.3 🟠 | 97 | 71 | ±13 | Slight Variation |
| Difference | +8.7 points | - | - | - | Nuxt 4 Win |
Core Performance Metrics Comparison
| Metric | Nuxt 4 | Next.js 16 | Winner | Difference |
|---|---|---|---|---|
| First Contentful Paint (FCP) | 1.8s | 0.87s | Next.js 16 | 2.07 times faster |
| Largest Contentful Paint (LCP) | 1.9s | 2.43s | Nuxt 4 | 1.28 times faster |
| Total Blocking Time (TBT) | 93.3ms | 596.7ms | Nuxt 4 | 6.39 times less |
| Speed Index | 2.47s | 1.07s | Next.js 16 | 2.31 times faster |
| Cumulative Layout Shift (CLS) | 0 | 0 | Same | Same |
Measurement Stability Comparison
| Framework | Performance Variation | TBT Variation | FCP Variation | Evaluation |
|---|---|---|---|---|
| Nuxt 4 | 99→99→93 (±3) | 60→50→170ms | 1.7→1.7→2.0s | ⭐⭐⭐⭐ |
| Next.js 16 | 71→97→97 (±13) | 1730→30→30ms | 1.0→0.8→0.8s | ⭐⭐⭐ |
Nuxt 4’s Advantages
- Overall Performance Score: Average 97 points for excellent
- LCP (Largest Contentful Paint): 1.9 seconds for excellent (recommended: 2.5 seconds or less)
- TBT (Total Blocking Time): Average 93.3ms for very low
- Consistency: 3 measurements, 2 of which are 99 points for very stable
- Layout Stability: CLS 0 for perfect
Next.js 16’s Features
- FCP (First Contentful Paint): 0.87 seconds for very fast
- Speed Index: 1.07 seconds for excellent
- 1st Measurement Issue: TBT 1,730ms for very high, but 2-3rd measurements are 30ms for improvement
- Performance Variation: 71→97 points for large variation
- Average TBT Issue: 596.7ms for high (1st measurement influence) 🔴
Next.js 16 1st Measurement Issue
- 1st: TBT 1,730ms (Performance 71 points)
- 2-3rd: TBT 30ms (Performance 97 points)
- Analysis: Initial build/cache warming up issue
5. Analysis of Vercel Deployment Build
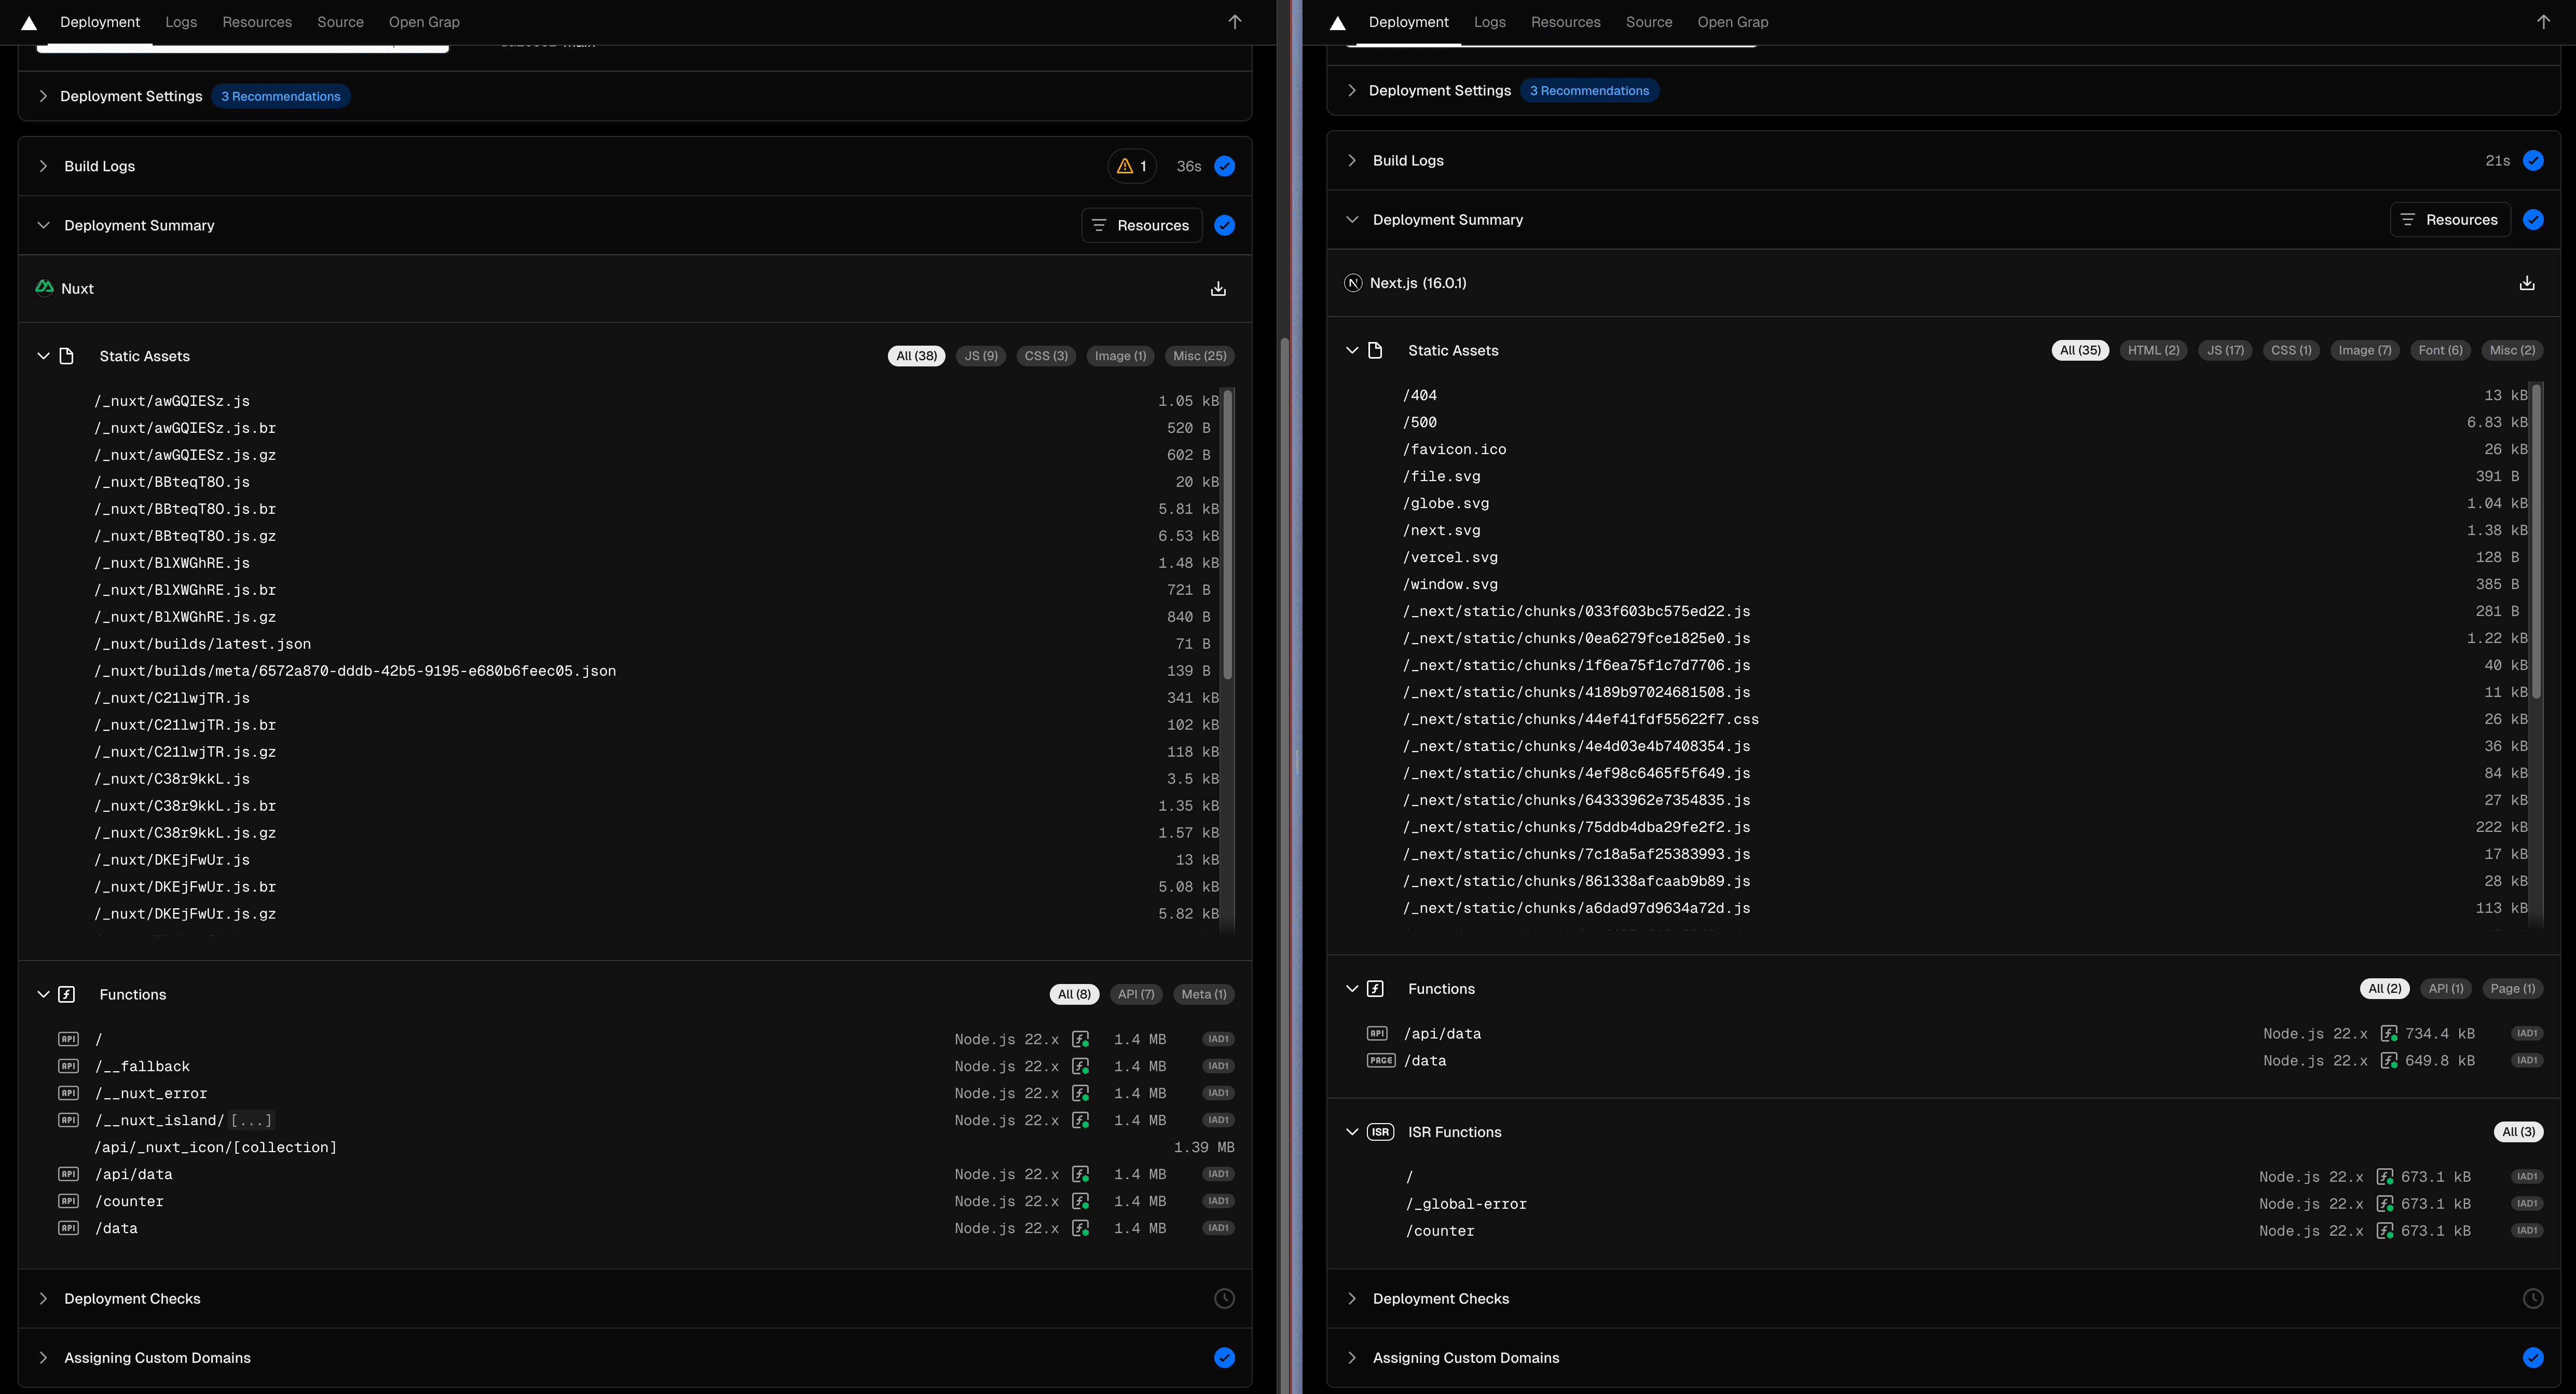
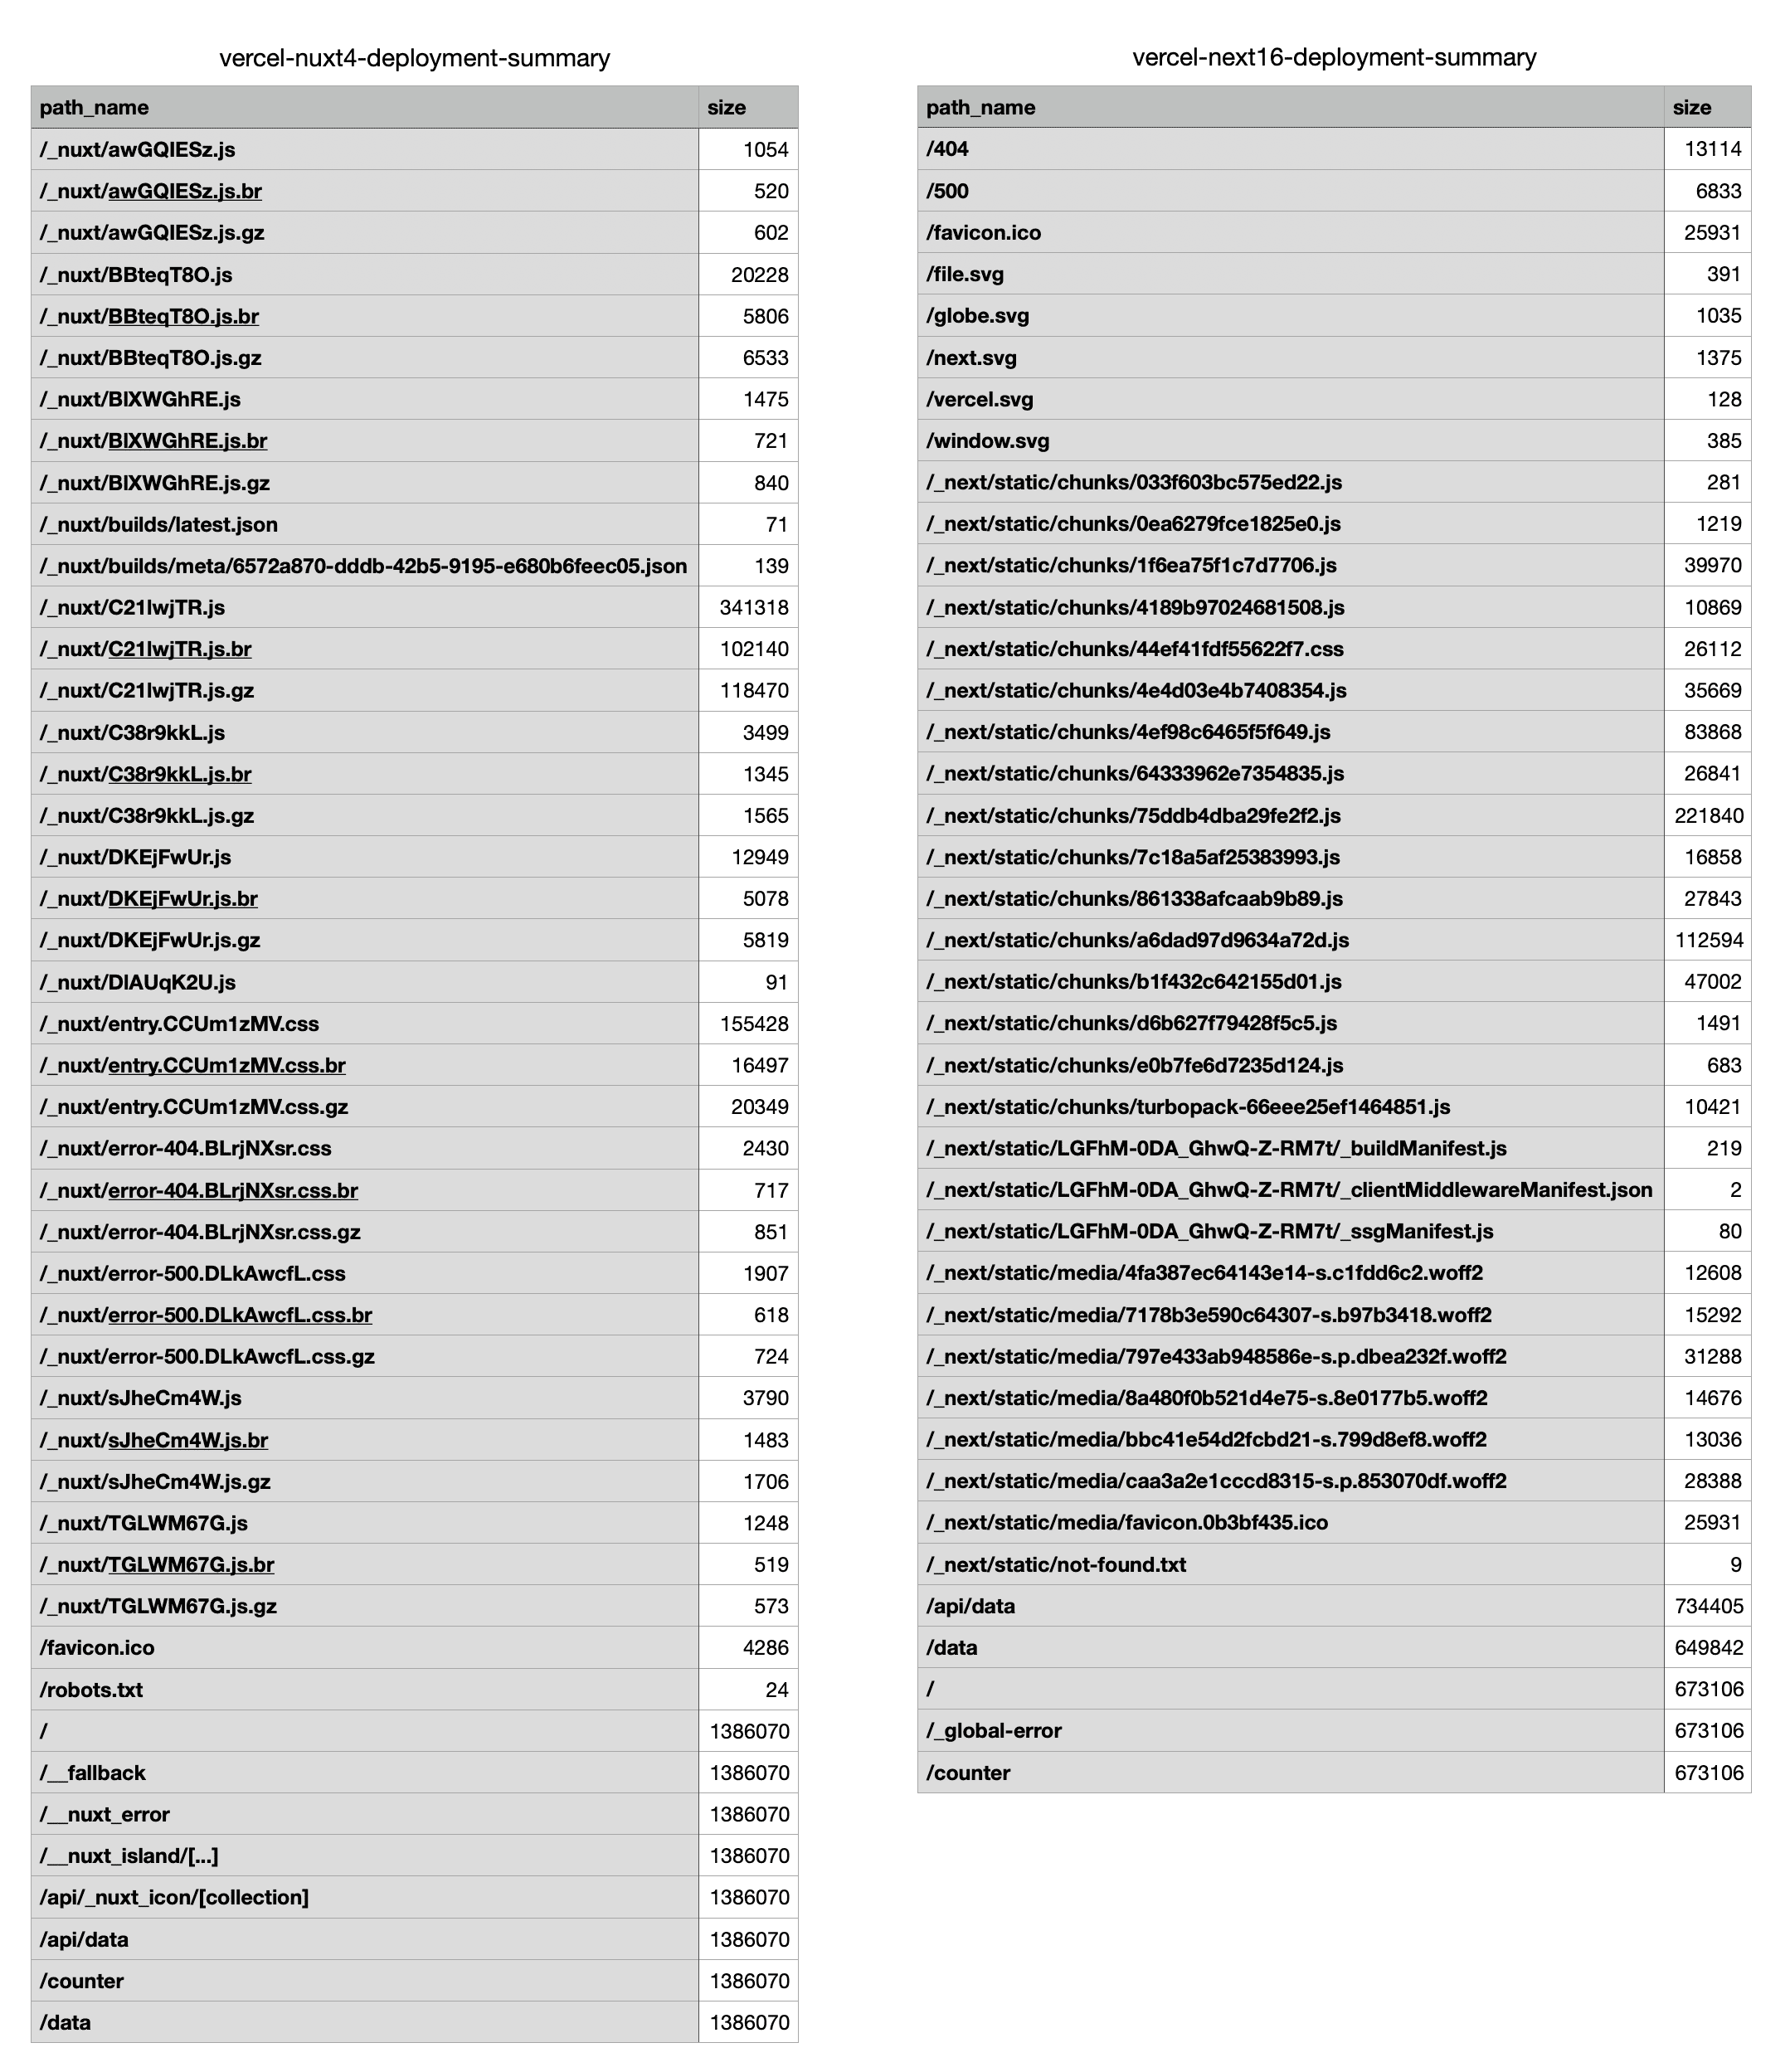
Static Assets Comparison
JavaScript Bundle Size
| Framework | Total JS Size (Before Compression) | Main Bundle | Bundle Count |
|---|---|---|---|
| Nuxt 4 | ~384 KB | Maximum: 341.3 KB (C21lwjTR.js) | 8 |
| Next.js 16 | ~664 KB | Maximum: 221.8 KB (75ddb4dba29fe2f2.js) | 15 |
Nuxt 4 - Main JavaScript Files
| File | Size (Original) | Size (Brotli) | Compression Rate |
|---|---|---|---|
| C21lwjTR.js | 341,318 bytes (333 KB) | 102,140 bytes (100 KB) | 70.1% decrease |
| BBteqT8O.js | 20,228 bytes (20 KB) | 5,806 bytes (5.7 KB) | 71.3% decrease |
| DKEjFwUr.js | 12,949 bytes (12.6 KB) | 5,078 bytes (5 KB) | 60.8% decrease |
Next.js 16 - Main JavaScript Files
| File | Size | Estimated Purpose |
|---|---|---|
| 75ddb4dba29fe2f2.js | 221,840 bytes (217 KB) | Main Bundle |
| a6dad97d9634a72d.js | 112,594 bytes (110 KB) | Additional Bundle |
| 4ef98c6465f5f649.js | 83,868 bytes (82 KB) | Additional Bundle |
| b1f432c642155d01.js | 47,002 bytes (46 KB) | Additional Bundle |
| 1f6ea75f1c7d7706.js | 39,970 bytes (39 KB) | Additional Bundle |
| 4e4d03e4b7408354.js | 35,669 bytes (35 KB) | Additional Bundle |
CSS Bundle Size
| Framework | Total CSS Size (Before Compression) | Brotli Compression After |
|---|---|---|
| Nuxt 4 | 159,765 bytes (156 KB) | 17,832 bytes (17.4 KB) |
| Next.js 16 | 26,112 bytes (25.5 KB) | N/A |
Serverless Functions Size
Nuxt 4 - Main Pages/API
| Path | Size |
|---|---|
| / (Home) | 1,386,070 bytes (1.32 MB) 🔴🔴 |
| /api/data | 1,386,070 bytes (1.32 MB) 🔴🔴 |
| /counter | 1,386,070 bytes (1.32 MB) 🔴🔴 |
| /data | 1,386,070 bytes (1.32 MB) 🔴🔴 |
Next.js 16 - Main Pages/API
| Path | Size |
|---|---|
| /api/data | 734,405 bytes (717 KB) 🔴 |
| / (Home) | 673,106 bytes (657 KB) 🔴 |
| /data | 649,842 bytes (635 KB) 🔴 |
| /counter | 673,106 bytes (657 KB) 🔴 |
| /404 | 13,114 bytes (12.8 KB) |
| /500 | 6,833 bytes (6.7 KB) |
Compression Strategy Comparison
| Framework | Compression Strategy | Applicable Range |
|---|---|---|
| Next.js 16 | None | Static assets only |
| Nuxt 4 | Brotli + Gzip | All JS/CSS files |
Overall Comparison Table
| Item | Next.js 16 | Nuxt 4 | Winner |
|---|---|---|---|
| Client JS Size | ~664 KB | ~384 KB (Original) / ~100 KB (Brotli) | Nuxt 4 |
| CSS Size | ~26 KB | ~156 KB (Original) / ~17 KB (Brotli) | Next.js 16 |
| Serverless Functions Size | 650-735 KB | 1.32 MB | Next.js 16 |
| Compression Support | ❌ | ✅ (Brotli + Gzip) | Nuxt 4 |
| Bundle Optimization | Code Splitting Excellent | Large Single Bundle | Next.js 16 |
Next.js 16’s Advantages
- Small Serverless Functions: 650-735 KB for half of
Nuxt 4 - Efficient Code Splitting: 15 small chunks for efficient code splitting
- Small CSS Bundle: 26 KB for very lightweight
Nuxt 4’s Advantages
- Compression Optimization:
Gzip Compressionfor significantly reducing actual transmission size
- Main JS: 333 KB → 100 KB (70% decrease)
- Main CSS: 152 KB → 16 KB (89% decrease)
- Actual Size is Smaller after Compression: Total ~117 KB vs
Next.js~664 KB
Nuxt 4’s Disadvantages
- Serverless Functions Size: 1.32 MB for very large (
Next.js’s 2x) - Large Single Bundle: 333 KB Main Bundle (Before Compression)
- CSS Size: 152 KB for large (Before Compression)
Client Performance
- Nuxt 4 우위: Compression applied, actual transmission size is much smaller (~117 KB vs ~664 KB)
Next.jshas no compression, so more data transmission is needed
Serverless Functions Efficiency
- Next.js 16 Win: Serverless Functions are half the size, reducing Cold Start time
Actual User Experience
| Aspect | Winner | Reason |
|---|---|---|
| Initial Loading | Nuxt 4 | Compressed JS/CSS transmission size is much smaller |
| Server Response | Next.js 16 | Serverless Functions are smaller, faster execution |
| Caching Efficiency | Next.js 16 | Partial caching with smaller chunks is advantageous |
| Bandwidth Usage | Nuxt 4 | Data transmission amount reduced by 70-89% by compression |
6. Client Environment Analysis
Nuxt 4 - Desktop Environment
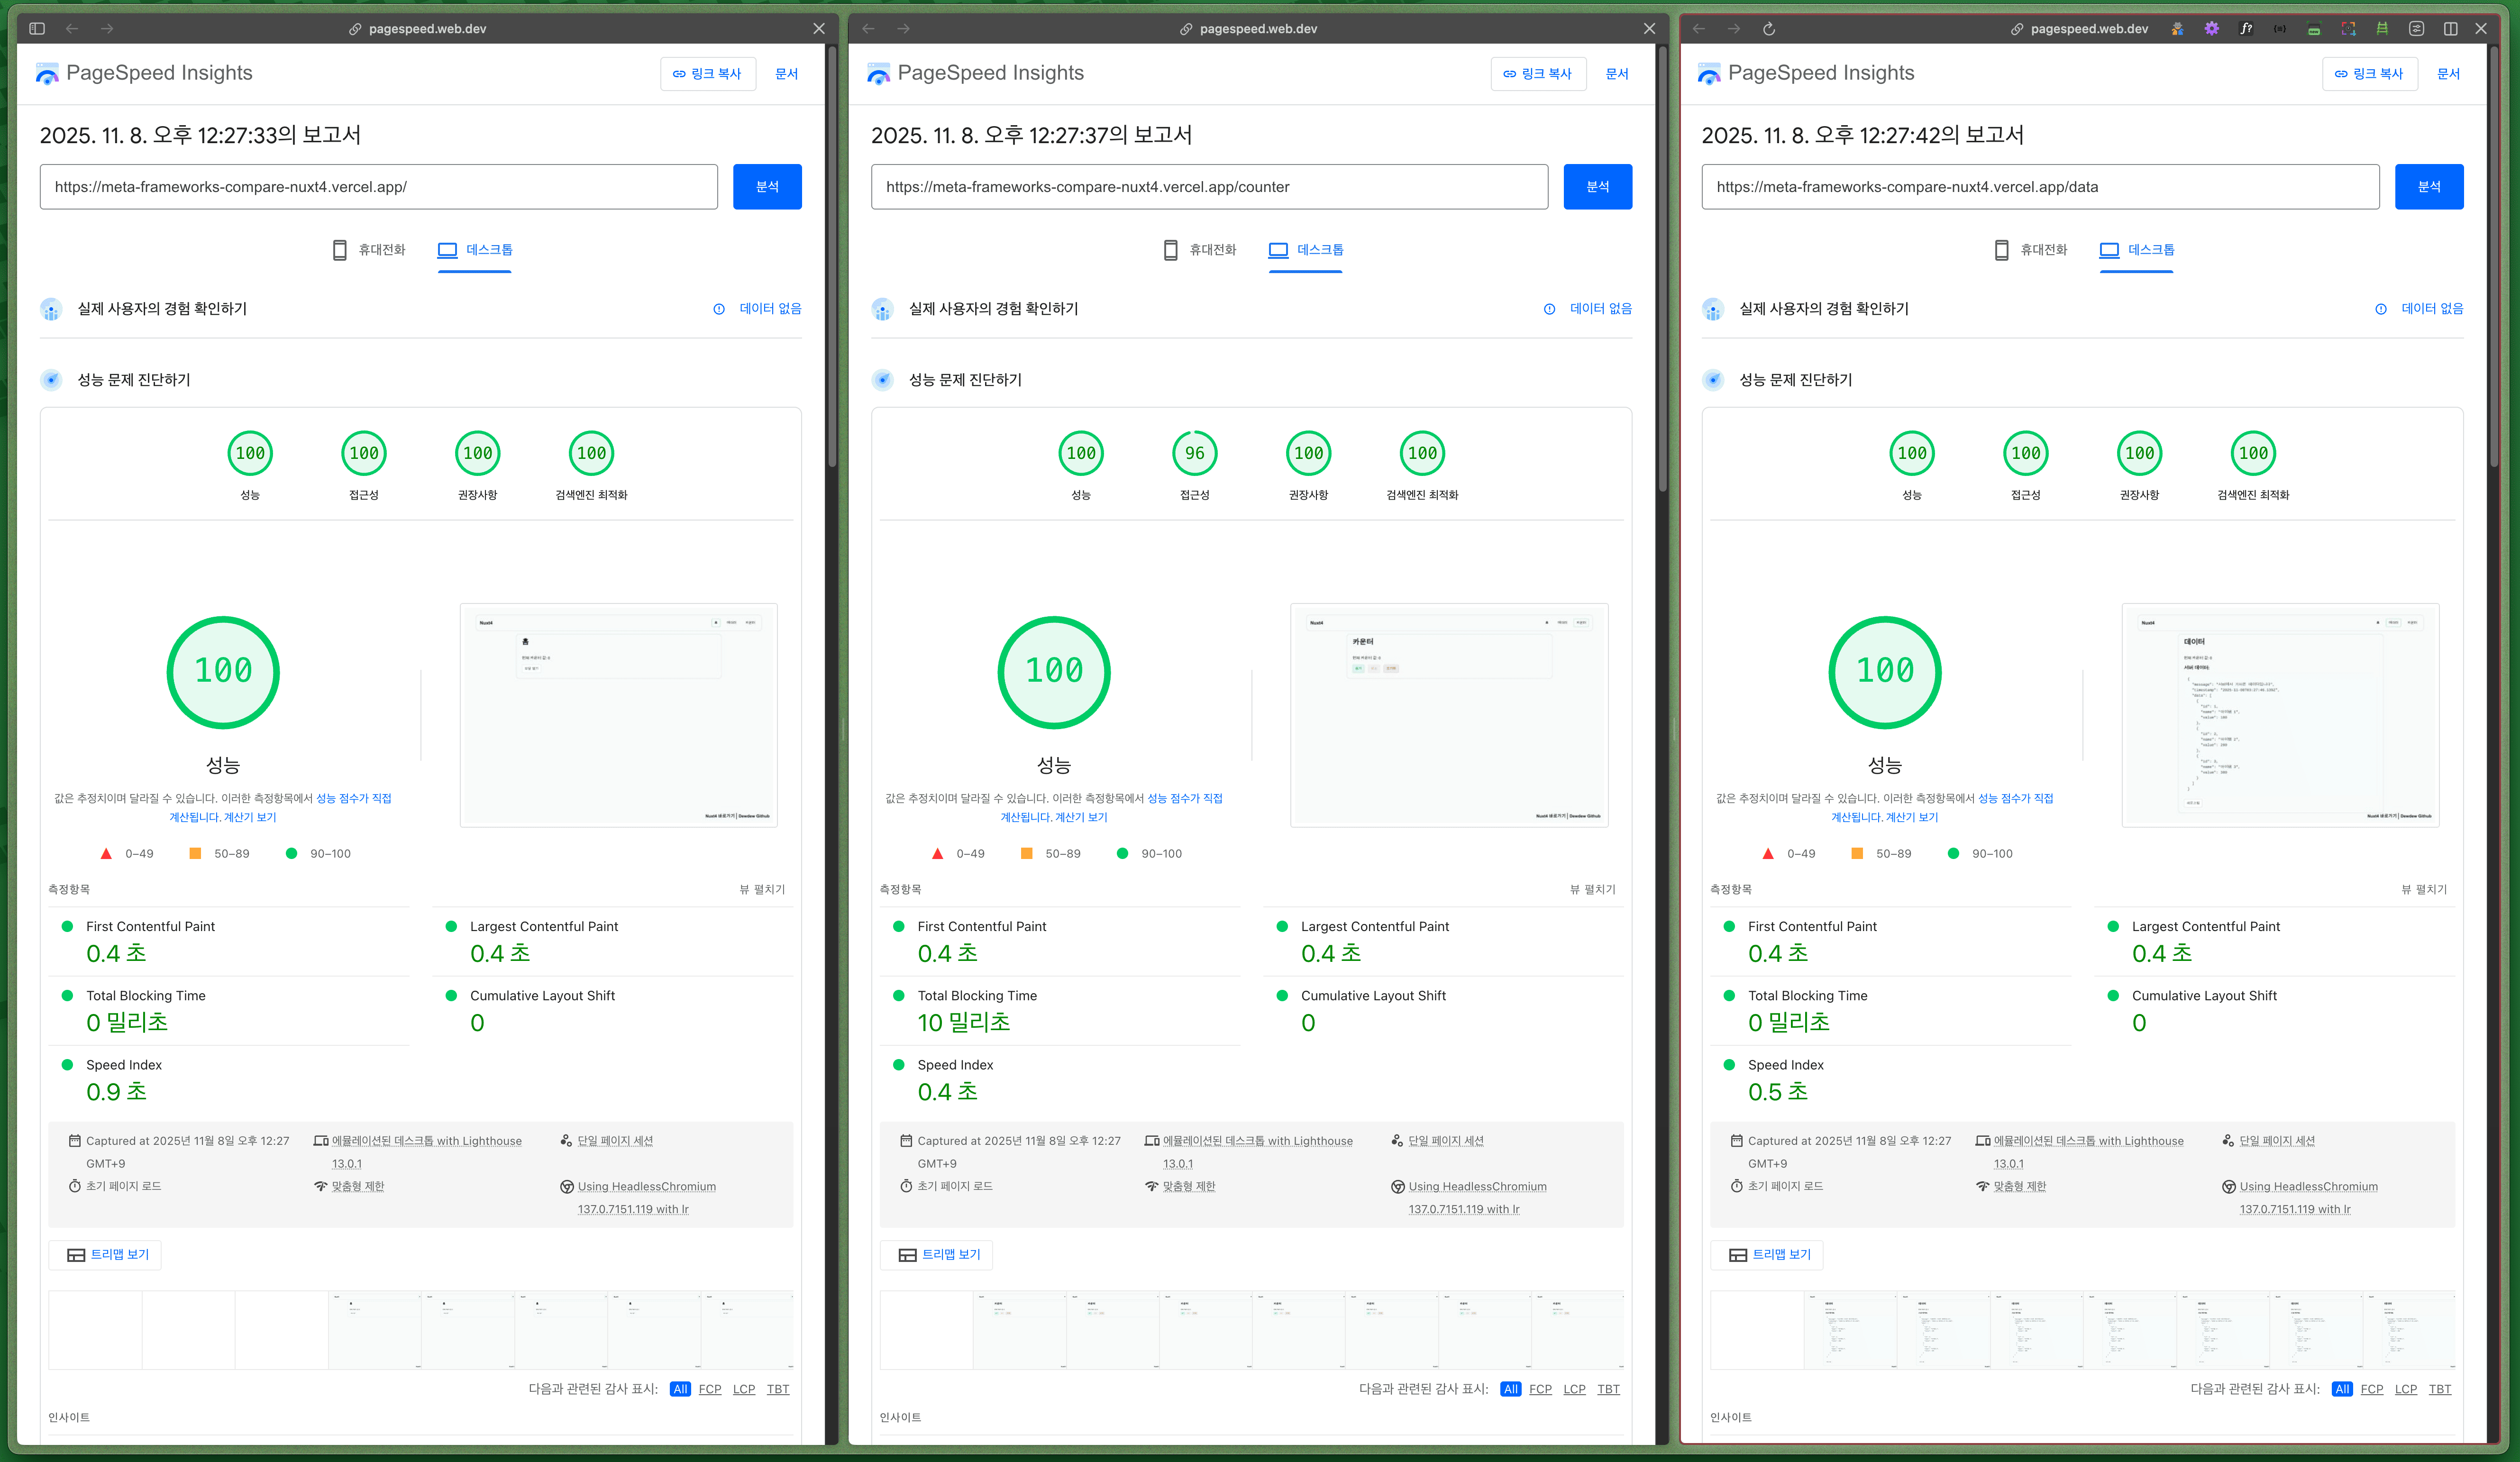
| Page | Performance | Accessibility | Recommended Practices | SEO | FCP | LCP | TBT | Speed Index | CLS |
|---|---|---|---|---|---|---|---|---|---|
| / | 100 🟢 | 100 🟢 | 100 🟢 | 100 🟢 | 0.4s | 0.4s | 0ms | 0.9s | 0 |
| /counter | 100 🟢 | 96 🟠 | 100 🟢 | 100 🟢 | 0.4s | 0.4s | 10ms | 0.4s | 0 |
| /data | 100 🟢 | 100 🟢 | 100 🟢 | 100 🟢 | 0.4s | 0.4s | 0ms | 0.5s | 0 |
Nuxt 4 - Mobile Environment
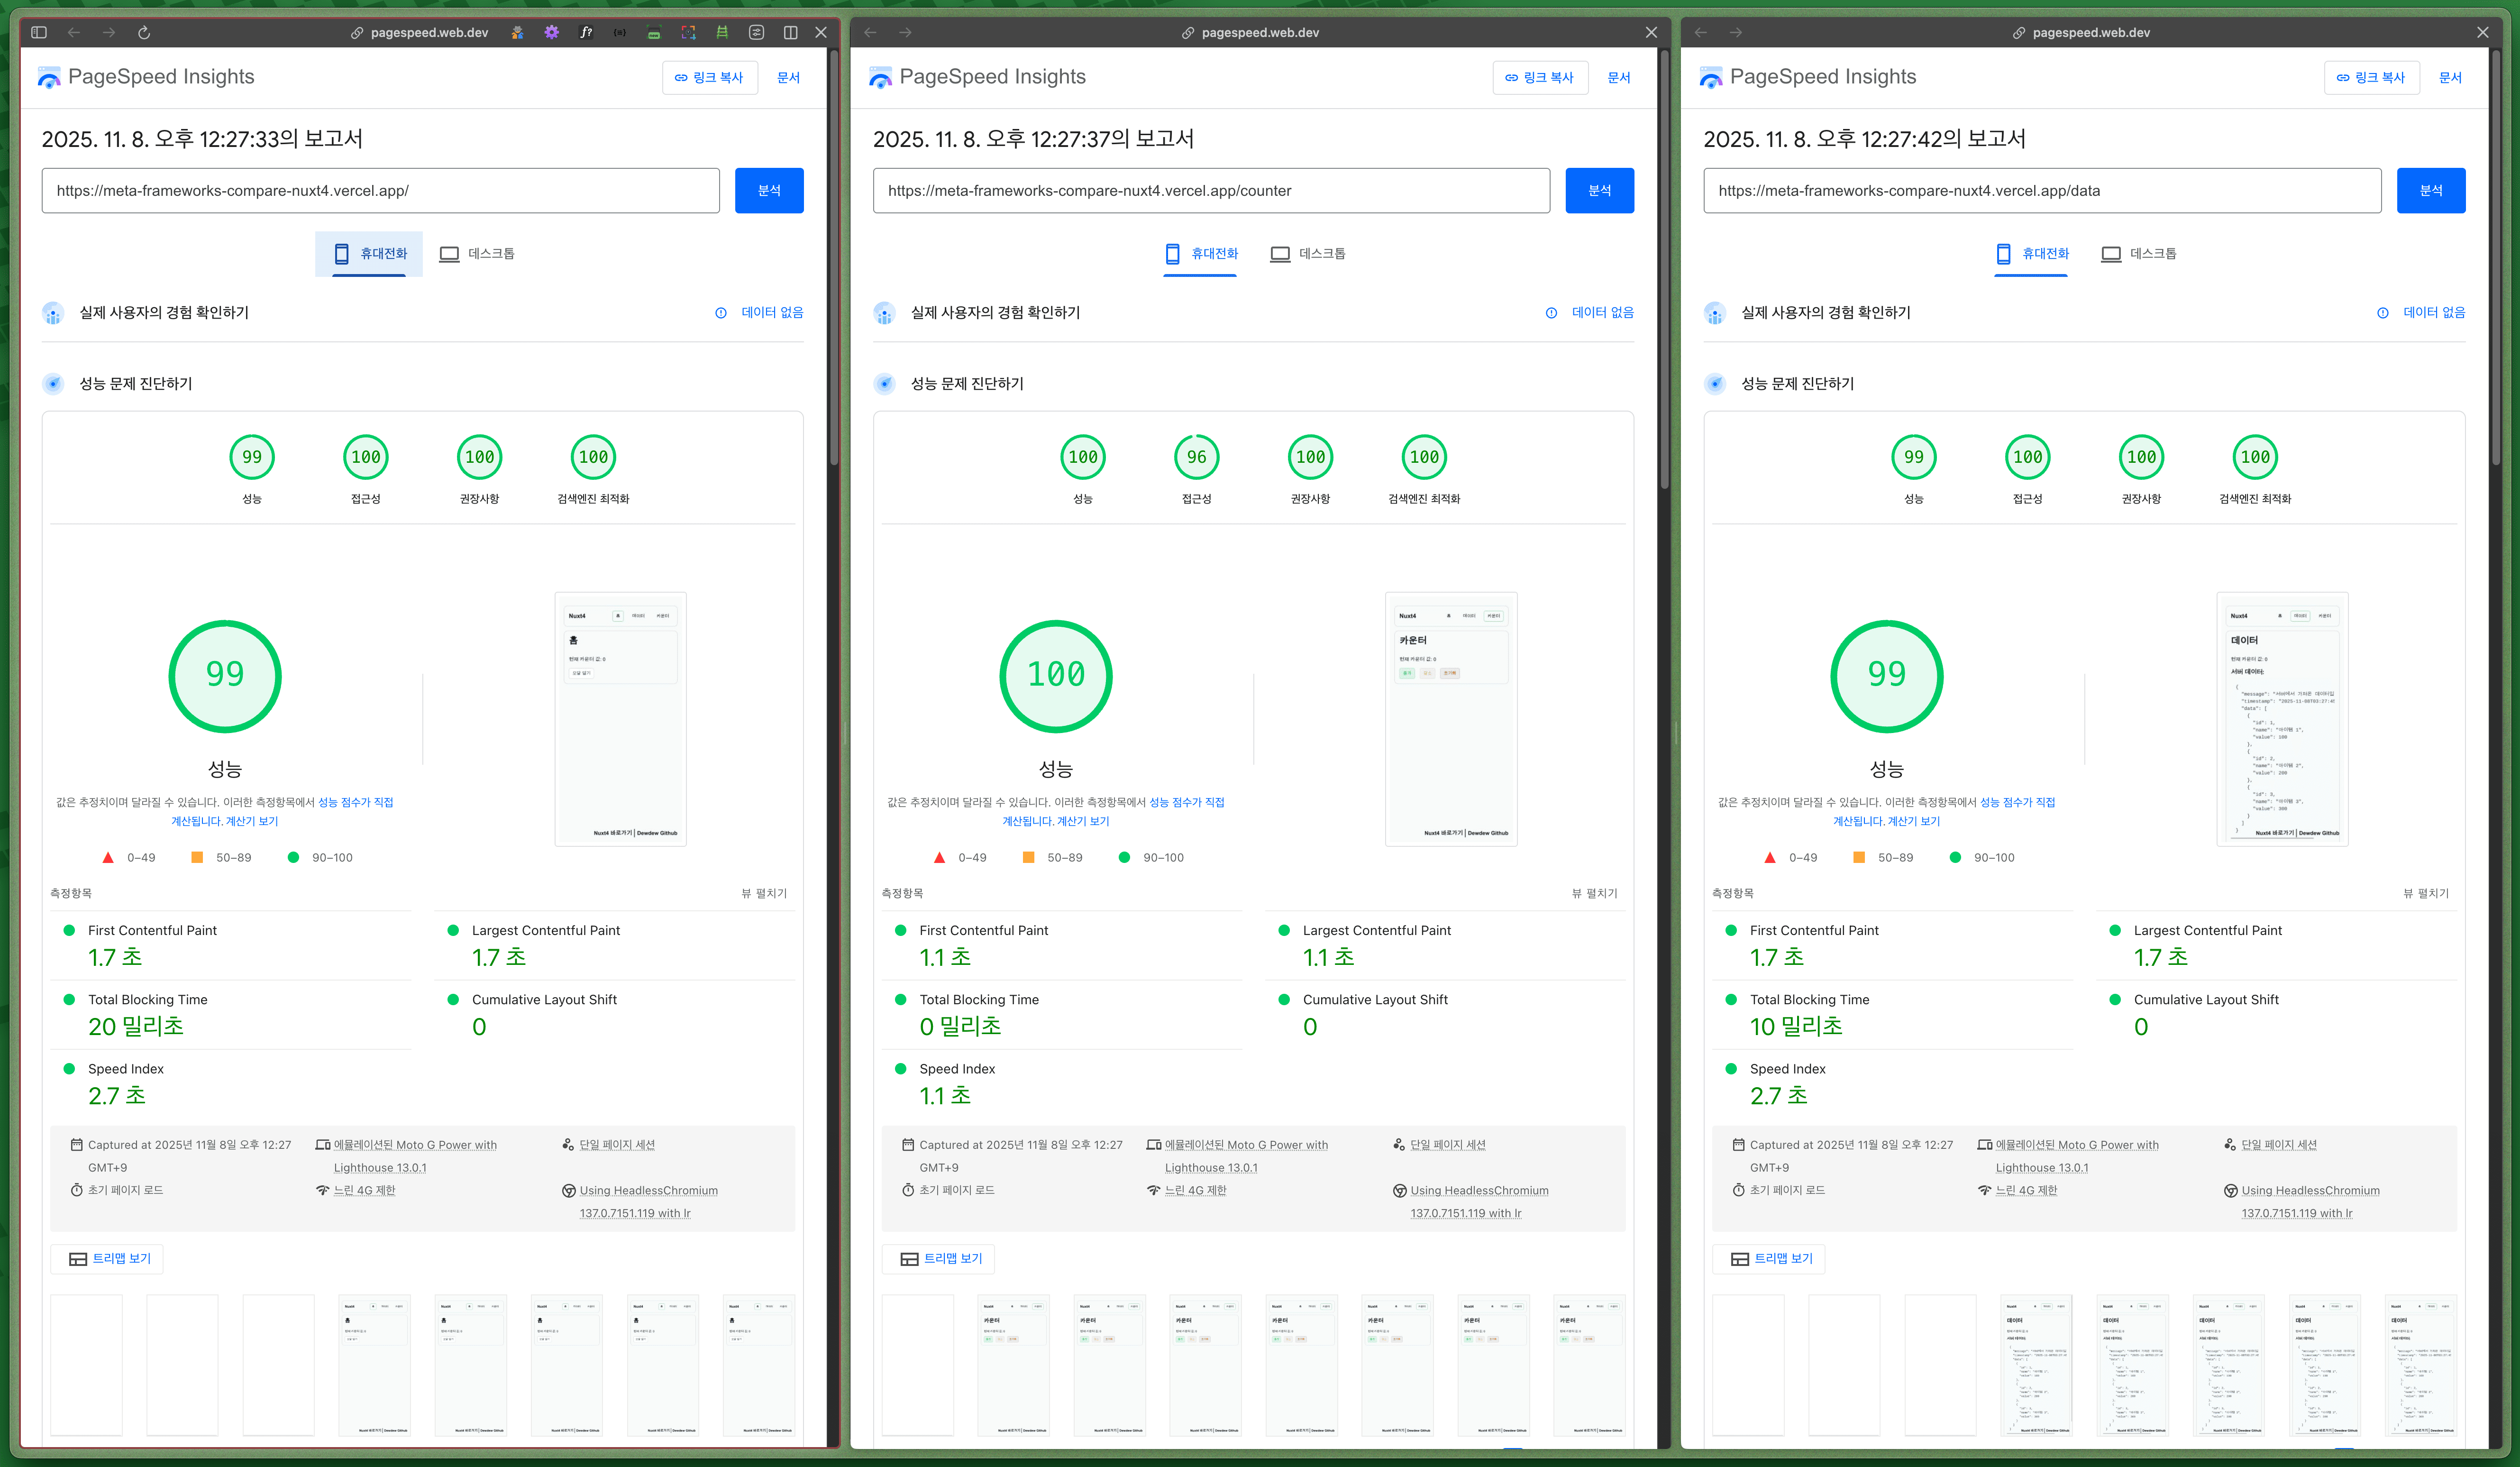
| Page | Performance | Accessibility | Recommended Practices | SEO | FCP | LCP | TBT | Speed Index | CLS |
|---|---|---|---|---|---|---|---|---|---|
| / | 99 🟢 | 100 🟢 | 100 🟢 | 100 🟢 | 1.1s | 1.7s | 20ms | 2.7s | 0 |
| /counter | 100 🟢 | 96 🟠 | 100 🟢 | 100 🟢 | 1.7s | 1.1s | 0ms | 1.1s | 0 |
| /data | 99 🟢 | 100 🟢 | 100 🟢 | 100 🟢 | 1.7s | 1.7s | 10ms | 2.7s | 0 |
Next.js 16 - Desktop Environment

| Page | Performance | Accessibility | Recommended Practices | SEO | FCP | LCP | TBT | Speed Index | CLS |
|---|---|---|---|---|---|---|---|---|---|
| / | 100 🟢 | 100 🟢 | 100 🟢 | 100 🟢 | 0.2s | 0.4s | 10ms | 0.5s | 0 |
| /counter | 100 🟢 | 95 🟠 | 100 🟢 | 100 🟢 | 0.2s | 0.4s | 0ms | 0.2s | 0 |
| /data | 100 🟢 | 100 🟢 | 100 🟢 | 100 🟢 | 0.2s | 0.4s | 0ms | 0.4s | 0 |
Next.js 16 - Mobile Environment

| Page | Performance | Accessibility | Recommended Practices | SEO | FCP | LCP | TBT | Speed Index | CLS |
|---|---|---|---|---|---|---|---|---|---|
| / | 99 🟢 | 100 🟢 | 100 🟢 | 100 🟢 | 1.2s | 1.3s | 10ms | 2.8s | 0 |
| /counter | 99 🟢 | 95 🟠 | 100 🟢 | 100 🟢 | 1.2s | 1.3s | 0ms | 1.2s | 0 |
| /data | 100 🟢 | 100 🟢 | 100 🟢 | 100 🟢 | 0.8s | 1.3s | 50ms | 0.9s | 0 |
Desktop Environment Comparison
| Metric | Next.js 16 Average | Nuxt 4 Average | Difference |
|---|---|---|---|
| Performance | 100 | 100 | - |
| FCP | 0.2s | 0.4s | Next.js 16 is 2x faster |
| LCP | 0.4s | 0.4s | - |
| TBT | 3.3ms | 3.3ms | - |
| Speed Index | 0.37s | 0.6s | Next.js 16 is 1.6x faster |
| CLS | 0 | 0 | - |
Mobile Environment Comparison
| Metric | Next.js 16 Average | Nuxt 4 Average | Difference |
|---|---|---|---|
| Performance | 99.3 | 99.3 | - |
| FCP | 1.07s | 1.5s | Next.js 16 is 1.4x faster |
| LCP | 1.3s | 1.5s | Next.js 16 is 1.15x faster |
| TBT | 20ms | 10ms | Nuxt is 2x faster |
| Speed Index | 1.63s | 2.17s | Next.js 16 is 1.33x faster |
| CLS | 0 | 0 | - |
Page-by-Page Performance Comparison
Root (/)
| Environment | Metric | Nuxt 4 | Next.js 16 |
|---|---|---|---|
| Desktop | Performance | 100 | 100 |
| FCP | 0.4s | 0.2s | |
| Mobile | Performance | 99 | 99 |
| FCP | 1.1s | 1.2s |
Counter (/counter)
| Environment | Metric | Nuxt 4 | Next.js 16 |
|---|---|---|---|
| Desktop | Performance | 100 | 100 |
| Speed Index | 0.4s | 0.2s | |
| Mobile | Performance | 100 | 99 |
| Speed Index | 1.1s | 1.2s |
Data (/data)
| Environment | Metric | Nuxt 4 | Next.js 16 |
|---|---|---|---|
| Desktop | Performance | 100 | 100 |
| FCP | 0.4s | 0.2s | |
| Mobile | Performance | 99 | 100 |
| TBT | 10ms | 50ms |
Desktop Environment
- Both are perfect performance: Performance 100 points are the same
- Next.js 16 slightly better: FCP and Speed Index are slightly faster
- Actual difference: Very small (0.2s vs 0.4s)
Mobile Environment
- Performance score: Same (99.3 points)
- Next.js 16 Win: FCP, LCP, Speed Index are consistently faster
- Nuxt 4 Win: TBT(JavaScript blocking) is 2x less
Accessibility Score
- Counter Page: Both are 95-96 points, slightly lower
- Other Pages: All 100 points, perfect
Both frameworks show excellent performance in the client environment, and the difference in actual use is almost negligible!
Nuxt 4 vs Next.js 16 Final Comprehensive Performance Comparison
1. Local Environment - Server Performance Measurement
Conclusion: Nuxt 4 overwhelming victory ⭐⭐⭐⭐⭐
| Metric | Nuxt 4 | Next.js 16 | Winner | Performance Difference |
|---|---|---|---|---|
| Average Latency | 13.11ms | 157.49ms | Nuxt 4 | 12x faster |
| Requests per Second | 734 req/s | 63.1 req/s | Nuxt 4 | 11.6x more |
| Data Transfer Rate | 97.82 MB/s | 21.17 MB/s | Nuxt 4 | 4.6x higher |
| Standard Deviation | 6.01ms | 68.68ms | Nuxt 4 | 11.4x consistent |
| Error Rate | 0 | 0 | Same | - |
2. Local Environment - Lighthouse Measurement
Conclusion: Nuxt 4 victory (LCP & TBT overwhelming) ⭐⭐⭐⭐⭐
| Metric | Nuxt 4 | Next.js 16 | Winner | Difference |
|---|---|---|---|---|
| Performance Score | 99 (±0) | 82 (±1) | Nuxt 4 | +17 points |
| FCP | 1.7s | 0.8s | Next.js 16 | 2.1x faster |
| LCP | 1.8s | 4.77s | Nuxt 4 | 2.65x faster |
| TBT | 6.7ms | 103.3ms | Nuxt 4 | 15.4x less |
| Speed Index | 1.7s | 0.8s | Next.js 16 | 2.1x faster |
| CLS | 0 | 0 | Same | - |
3. Deployment Environment - Server Performance Measurement
Conclusion: Next.js 16 overwhelming victory ⭐⭐⭐⭐⭐
| Metric | Nuxt 4 | Next.js 16 | Winner | Performance Difference |
|---|---|---|---|---|
| Average Latency | 69.62ms | 24.20ms | Next.js 16 | 2.88x faster |
| Requests per Second | 294.4 req/s | 407.7 req/s | Next.js 16 | 38.5% more |
| Data Transfer Rate | 26.48 MB/s | 76.74 MB/s | Next.js 16 | 2.90x higher |
| Standard Deviation | 18.66ms | 26.45ms | Nuxt 4 | More consistent |
| Total Requests (10 seconds) | 2,944 | 4,822 | Next.js 16 | 63.8% more |
4. Deployment Environment - Lighthouse Measurement
Note:
Next.js 16’s first measurement shows TBT 1,730ms (very high)- 2-3 measurements show rapid improvement (20-30ms)
Nuxt 4maintains excellent performance consistently
Conclusion: Nuxt 4 victory (more consistent and stable) ⭐⭐⭐⭐⭐
| Metric | Nuxt 4 | Next.js 16 | Winner | Difference |
|---|---|---|---|---|
| Performance Score | 97.7 | 91.8 | Nuxt 4 | +5.9 points |
| FCP | 1.76s | 0.84s | Next.js 16 | 2.1x faster |
| LCP | 1.86s | 2.54s | Nuxt 4 | 1.37x faster |
| TBT | 73.3ms | 368ms | Nuxt 4 | 5x less |
| Speed Index | 2.13s | 1.0s | Next.js 16 | 2.1x faster |
| CLS | 0 | 0 | Same | - |
| Consistency | Good (93→99→99) | Variation (71→97→97) | Nuxt 4 | More stable |
5. Vercel Build Analysis
Conclusion:
- Client:
Nuxt 4victory (5.9x less) - Server:
Next.js 16victory (half size)
| Item | Nuxt 4 | Next.js 16 | Winner |
|---|---|---|---|
| Client JS (Original) | 384 KB | 664 KB | Nuxt 4 |
| Client JS (Compressed) | 100 KB (Brotli) | 664 KB | Nuxt 4 |
| CSS (Original) | 156 KB | 26 KB | Next.js 16 |
| CSS (Compressed) | 17 KB (Brotli) | 26 KB | Nuxt 4 |
| Total Client Transfer | ~117 KB | ~690 KB | Nuxt 4 |
| Compression Rate | 70-89% reduction | None | Nuxt 4 |
| Server Function Size | 1.32 MB | 650-735 KB | Next.js 16 |
| Code Splitting | 8 chunks | 15 chunks | Next.js 16 |
6. Client Environment - Actual User Measurement
Conclusion:
- Desktop: Almost equal
- Mobile:
Next.js 16slightly better
Desktop Environment
| Metric | Nuxt 4 | Next.js 16 | Winner | Difference |
|---|---|---|---|---|
| Performance | 100 | 100 | Same | - |
| FCP | 0.4s | 0.2s | Next.js 16 | 2x faster |
| LCP | 0.4s | 0.4s | Same | - |
| TBT | 3.3ms | 3.3ms | Same | - |
| Speed Index | 0.6s | 0.37s | Next.js 16 | 1.6x faster |
Mobile Environment
| Metric | Nuxt 4 | Next.js 16 | Winner | Difference |
|---|---|---|---|---|
| Performance | 99.3 | 99.3 | Same | - |
| FCP | 1.5s | 1.07s | Next.js 16 | 1.4x faster |
| LCP | 1.5s | 1.3s | Next.js 16 | 1.15x faster |
| TBT | 10ms | 20ms | Nuxt 4 | 2x less faster |
| Speed Index | 2.17s | 1.63s | Next.js 16 | 1.33x faster |
Final Performance Comparison Summary
How did you feel?
I’ve forgotten when I’ve done such a thorough comparison…😂
Now, let’s finish with a final performance comparison!
1. 📈 Final Performance Summary
| Category | Nuxt4 Score | Nuxt4 Evaluation | Next16 Score | Next16 Evaluation |
|---|---|---|---|---|
| 🚀 Development Speed | 100/100 | S grade | 60/100 | C grade |
| 📦 Bundle Size | 95/100 | A grade | 65/100 | C grade |
| ⚡ Server Performance | 75/100 | B grade | 100/100 | S grade |
| 🎨 User Experience | 99/100 | S grade | 99/100 | S grade |
| 🔧 Consistency | 100/100 | S grade | 75/100 | B grade |
| Overall Average | 93.8/100 | A+ grade | 79.8/100 | B+ grade |
2. Environment-wise Performance Summary
| Test Environment | Nuxt 4 | Next.js 16 | Winner |
|---|---|---|---|
| 1. Local Server | ⭐⭐⭐⭐⭐ | ⭐⭐ | Nuxt 4 |
| 2. Local Lighthouse | ⭐⭐⭐⭐⭐ | ⭐⭐⭐⭐ | Nuxt 4 |
| 3. Deployment Server | ⭐⭐⭐ | ⭐⭐⭐⭐⭐ | Next.js 16 |
| 4. Deployment Lighthouse | ⭐⭐⭐⭐⭐ | ⭐⭐⭐⭐ | Nuxt 4 |
| 5. Build (Client) | ⭐⭐⭐⭐⭐ | ⭐⭐⭐ | Nuxt 4 |
| 6. Build (Server) | ⭐⭐⭐ | ⭐⭐⭐⭐⭐ | Next.js 16 |
| 7. Client (Desktop) | ⭐⭐⭐⭐⭐ | ⭐⭐⭐⭐⭐ | Same |
| 8. Client (Mobile) | ⭐⭐⭐⭐⭐ | ⭐⭐⭐⭐⭐ | Almost same |
3. Development Environment
| Area | Nuxt 4 | Next.js 16 | Winner | Difference |
|---|---|---|---|---|
| Local Server Speed | 13ms | 157ms | Nuxt 4 | 12x faster |
| Development Experience | Very fast | Slow | Nuxt 4 | - |
| Lighthouse Score | 99 | 82 | Nuxt 4 | +17 points |
4. Production Environment
| Area | Nuxt 4 | Next.js 16 | Winner | Difference |
|---|---|---|---|---|
| Server Response Speed | 70ms | 24ms | Next.js 16 | 2.9x faster |
| Request per Second | 294 req/s | 408 req/s | Next.js 16 | 38% more |
| Lighthouse Score | 97.7 | 91.8 | Nuxt 4 | +5.9 points |
| Client Bundle Size | 117 KB | 690 KB | Nuxt 4 | 5.9x less |
| Server Function Size | 1.32 MB | 650 KB | Next.js 16 | 2x less |
5. User Experience
| Area | Nuxt 4 | Next.js 16 | Winner |
|---|---|---|---|
| Desktop Performance | 100 | 100 | - |
| Mobile Performance | 99.3 | 99.3 | - |
| Bandwidth Usage | Very low | Normal | Nuxt 4 |
Conclusion
Both frameworks are clearly superior in different situations!
During development, Nuxt4 won with its 12x faster server and excellent development experience,
and in production server environments, Next16 is considered to be highly synchronized with Vercel.
(How will it be in AWS?)
And in Lighthouse scores, bundle size, and measurement stability, Nuxt4 was clearly superior!
Of course, since the user experience is almost the same, it seems pointless to compare it!
| Priority | Recommended Framework | Reason |
|---|---|---|
| Fast Development | Nuxt 4 🟢 | 12x faster local server |
| Best Server Performance | Next.js 16 🔵 | 2.9x faster response |
| Cost Efficiency | Nuxt 4 🟢 | 5.9x less bundle |
| Large-scale Traffic | Next.js 16 🔵 | 38% more request |
| Consistent Performance | Nuxt 4 🟢 | Stable measurement |
The source code and deployment environment of the two frameworks tested above is available below!
Github - Meta Framework Compare
Nuxt4
Next16
Let’s see you again in good articles!
See you in the next article!